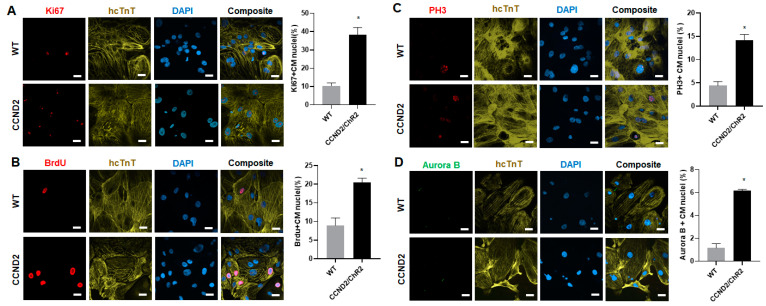
Figure 2.
Quantification of cell cycle of CCND2 overexpressing hiPSC-CMs in vitro. The hiPSC-CCND2WTCMs (WT) and hiPSC-CCND2OE/ChR2OECMs (CCND2) were cultured for 4 weeks after the initiation of cardiomyocyte differentiation, and then immunofluorescently stained for the presence of human cTnT (hcTnT); nuclei were identified via DAPI staining. (A) Proliferation was evaluated via immunofluorescence analyses of Ki67 expression in hiPSC-CCND2WTCMs and hiPSC-CCND2OE/ChR2OECMs and quantified as the percentage of positively stained cells. Scale bar = 20 µm. (B) S-phase cells were identified via immunofluorescence analyses of Brdu incorporation in hiPSC-CCND2WTCMs and hiPSC-CCND2OE/ChR2OECMs and quantified as the percentage of positively stained cells. Scale bar = 20 µm. (C) M-phase cells were identified via analyses of PH3 expression and quantified as the percentage of positively stained cells. Scale bar = 20 µm. (D) Cells undergoing cytokinesis were identified via Aurora B expression and quantified as the percentage of positively stained cells. Scale bar = 20 µm. *—p < 0.05 versus hiPSC-CCND2WTCMs by Student’s t-test. n = 6 repeats.

