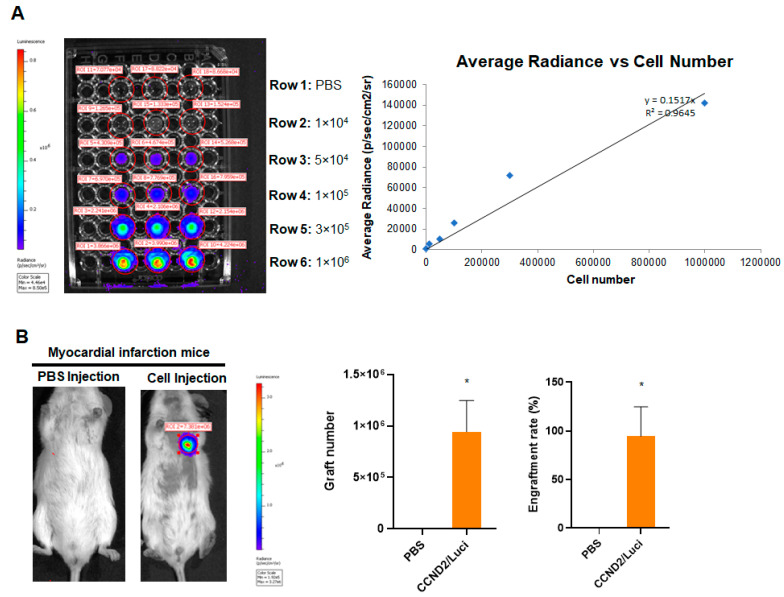
Figure 3.
Quantification of graft size in animals receiving CCND2 overexpressing hiPSC-CMs. Immediately after surgically induced myocardial infarction, the mice received intramyocardial injection of 1 million hiPSC-CCND2OE/LuciOECMs. Control mice received intramyocardial injection of PBS after myocardial infarction induction. The transplanted cells carried a luciferase reporter plasmid and were of human origin; thus, engraftment was evaluated via bioluminescence imaging at 6 months after cell transplantation. (A) A standard curve was generated from bioluminescence measurements of known quantities of hiPSC-CMs. (B) Six months after myocardial infarction induction and treatment with intramyocardial injections of PBS (n = 6 animals) or hiPSC-CCND2OE/LuciOECMs (n = 10 animals), the mice were injected with luciferin, and bioluminescence images were collected 10 min later. Bioluminescence signal intensity was compared to the standard curve to determine the number of engrafted cells; then, the engraftment rate was calculated by dividing the number of engrafted cells by the total number of cells administered and expressed as a percentage. *—p < 0.05 versus PBS-receiving group by Student’s t-test.

