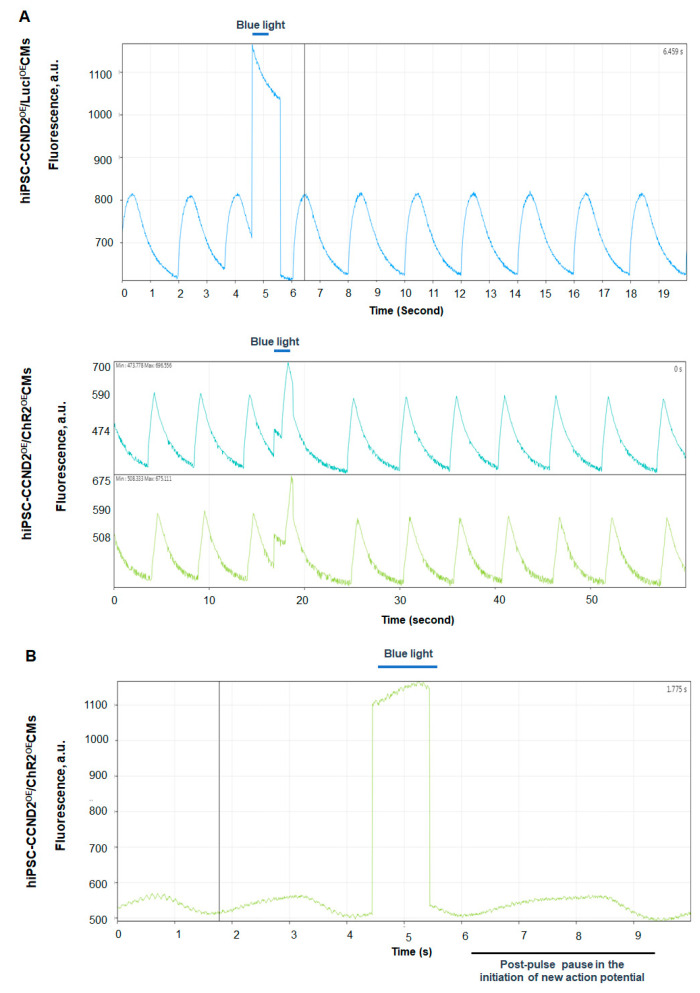
Figure 4.
Light-induced changes of calcium transients and action potential of hiPSC-CMs in vitro. (A) Calcium mapping. Spontaneous calcium transients in hiPSC-CCND2OE/LuciOECMs (upper trace) and hiPSC-CCND2OE/ChR2OECMs (middle and bottom traces). Blue light illumination (1 s) did not alter rhythmicity of calcium transients in the hiPSC-CCND2OE/LuciOECMs, whereas it delayed the subsequent cycle in hiPSC-CCND2OE/ChR2OECMs. (B) Voltage mapping. Spontaneous action potentials in hiPSC-CCND2OE/ChR2OECMs. Since RH-237 fluorescence decreases with depolarization, the peak and trough fluorescence intensities correspond to the maximal diastolic potential and peak action potential amplitude, respectively. Blue light illumination delayed the onset of the subsequent cycle. Contamination of the fluorescence signals by the blue excitation light prevents their proper interpretation during illumination.

