Figure 5.
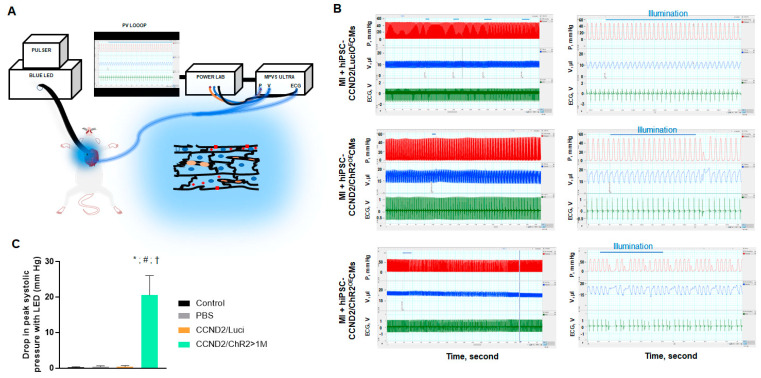
Light-induced changes of heart rhythm and left ventricle hemodynamics in mice. (A) Illustration of the optogenetic system. Red squares, ChR2 channels; red plus signs, membrane depolarization; blue ellipsoids, cardiomyocyte nuclei; orange ellipsoids, capillaries. (B) Recordings of left ventricular pressure (red), volume (blue), and electrogram (green) in anesthetized, open-chest NOD/SCID mice 6 months after permanent coronary artery ligation and intracardiac injection of hiPSC-CCND2OE/LuciOECMs (upper panels) or hiPSC-CCND2OE/ChR2OECMs before, during, and after blue light illumination (middle and lower panels). Center panels show tracings from the same animals on the left (boxed region) at expanded time scales. Horizontal blue lines indicate duration of blue light pulses. Premature ventricular complexes (PVC) were recorded with light illumination in mice receiving hiPSC-CCND2OE/ChR2OECMs. The arrhythmic effect and decline in cardiac function were mostly transient (row 2, for 3 mice), but lasted for up to 2 min (row 3, 1 mouse). X, Y labels and values are added to improve readability, (Left) LabChart Scale 500:1, (Right) Scale 20:1. (C) At the onset of PVC, reduction in systolic ventricular pressure (Pmax) was recorded. *—p < 0.05 versus sham control group; #—p < 0.05 versus PBS injection group; †—p < 0.05 versus CCND2OE/LuciOE group. n = 8 mice in sham control; n = 6 mice in PBS injection group; n = 10 mice in hiPSC-CCND2OE/LuciOECMs group; n = 10 mice in hiPSC-CCND2OE/ChR2OECMs group.

