Figure 3.
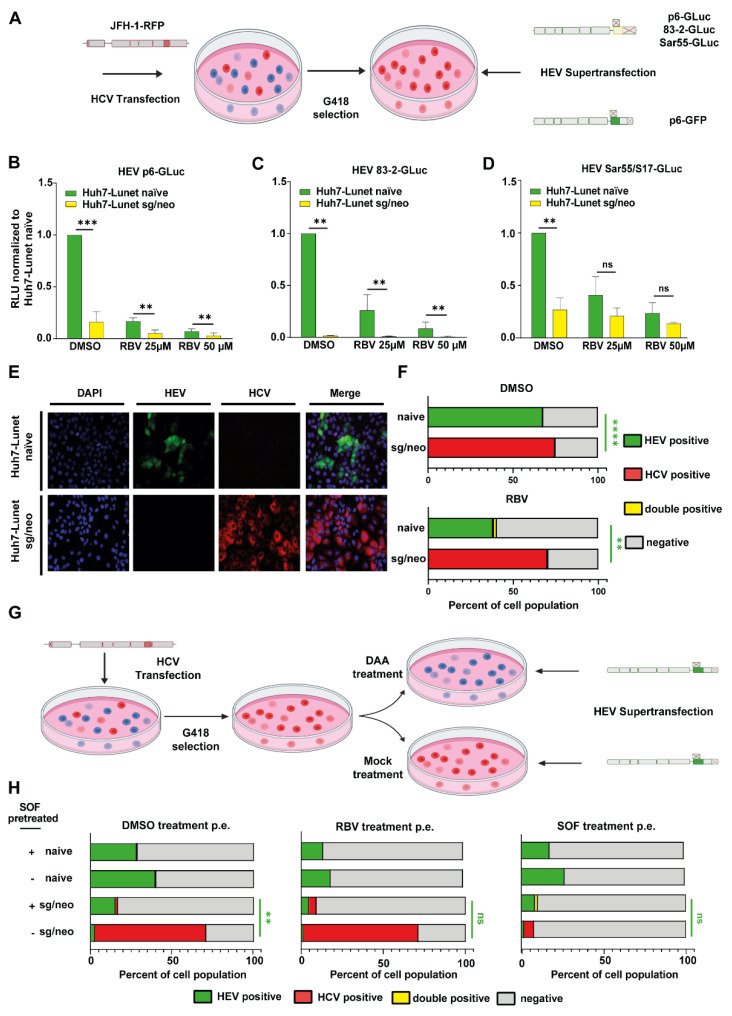
HEV replication in HCV-selected human hepatocytes. (A) Schematic representation of experimental setup for panels (B–F). Huh7 cells were transfected with a selectable HCV subgenomic replicon expressing RFP, JFH1-NS5A-RFP, and selected and subsequently transfected with either an HEV luciferase reporter or GFP reporter subgenomic replicon. G418 treatment was discontinued upon transfection to rule out unspecific effects on HEV. (B–D) Replication of HEV replicons 72 h post electroporation was assessed in naïve Huh7-Lunet cells or Huh7-Lunet cells expressing the selectable HCV subgenomic replicon (Huh7-Lunet/sg-neo). Cells were incubated with DMSO or ribavirin (RBV). Treatment was started 4 h post electroporation. Depicted are means ± SD from three independent experiments. (Two-way ANOVA with Sidak’s multiple comparison test). (E) Representative IF pictures of Huh7-Lunet naïve (upper panel) or Huh7-Lunet/sg-neo cells (lower panel) transfected with a HEV p6-GFP subgenomic reporter replicon, imaged 5 days post electroporation. (F) Percentage of Huh7-Lunet naïve or Huh7-Lunet/sg-neo cells positive for HCV, HEV, both or none, as determined by flow cytometry 5 days post electroporation. Cells were treated with DMSO or 25 µM RBV. Depicted are means from three independent replicates. (Two-way ANOVA with Sidak’s multiple comparison test of positive cell percentages). (G) Schematic representation of experimental setup for panel (H). Cells were transfected with JFH1-NS5A-RFP, selected as in (B–F) and subsequently either cured with 10 µM sofosbuvir (DAA treatment) or treated with 0.1% DMSO (mock treatment) for 72 h prior to transfection of HEV subgenomic replicons. (H) Percentage of Huh7 Lunet naïve or Huh7-Lunet/sg-neo cells positive for HCV, HEV, both or none was assessed by flow cytometry 5 days post electroporation of HEV. Cells were treated with DMSO, 25 µM RBV or 10 µM sofosbuvir (SOF). Treatment was started 4 h post electroporation. Depicted are means ± SD of three independent experiments. (Two-way ANOVA with Sidak’s multiple comparison test of positive cell percentages). ** = p value < 0.01, *** = p value < 0.001; **** = p value < 0.0001.

