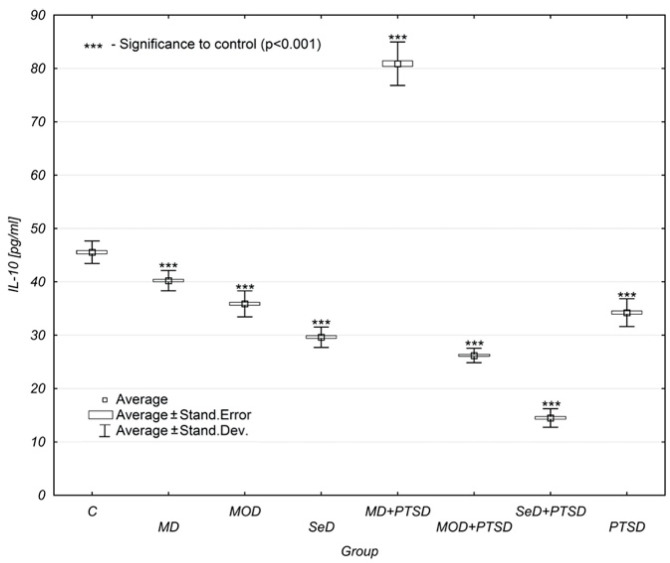
Figure 4.
Mean IL-10 concentration levels in selected study groups. Legends: C—control group, MD—mild depression; MOD—moderate depression; SD—severe depression; MD + PTSD—mild depression + posttraumatic stress disorder; MOD + PTSD—moderate depression + posttraumatic stress disorder; SeD + PTSD—severe depression + posttraumatic stress disorder; PTSD—posttraumatic stress disorder; IL-10—interleukin-10. Number of patients in the study groups (females + males): C = 80, MD = 120, MOD = 120, SD = 120, MD + PTSD = 120; MOD + PTSD = 120; SeD + PTSD = 60; PTSD = 120. *** p < 0.005 when compared to the control group. Since all data was distributed normally, the one-way ANOVA test was used for statistical analysis (data is presented in the form of a box plot, which can be used to estimate differences in the mean values; the graphs show the mean and standard error).

