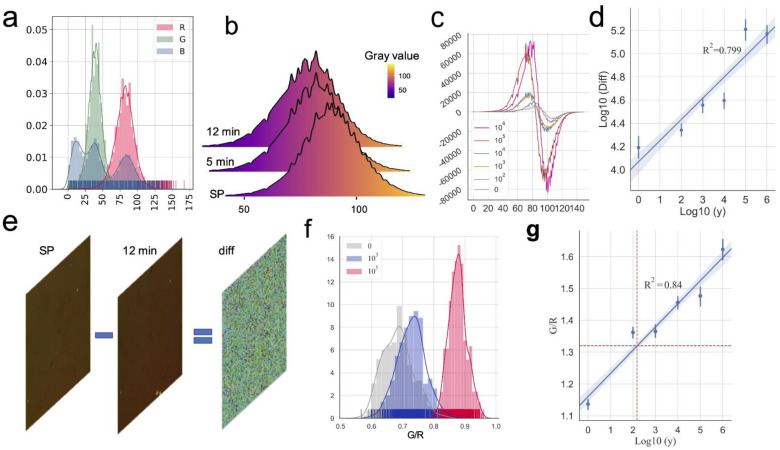
Figure 2.
The changes in the gray value of the RGB channels can be used to fit the changes of the SARS-CoV-2 virus concentration. (a) The histogram shows the RGB channels gray values count of the chip image after adding the detection antibody. (b) The three histograms show the R channel gray values count of chip image at start point (SP), and chip images 5 min and 12 min after adding detection antibody (105 vp/mL). (c) The figure shows the difference between the 12 min image and the SP image in each gray frequency of the R channel. (d) The fitting result of the linear regression model established by the LogDiff of the different SARS-CoV-2 virus concentrations (R2 = 0.799). (e) Schematic diagram of obtaining the median of the difference image. Subtract the two images (SP,12 min) to get the difference image. (f) The histogram shows the distribution of ratio of G mean to R mean of all cropped difference images at different virus concentrations. (g) The fitting result of the linear regression model established by the G/R ratio of all the sets (R2 = 0.84) The red dotted line of the y-axis is yblank + 3σmax, and the red dotted line of the x-axis is LOD.

