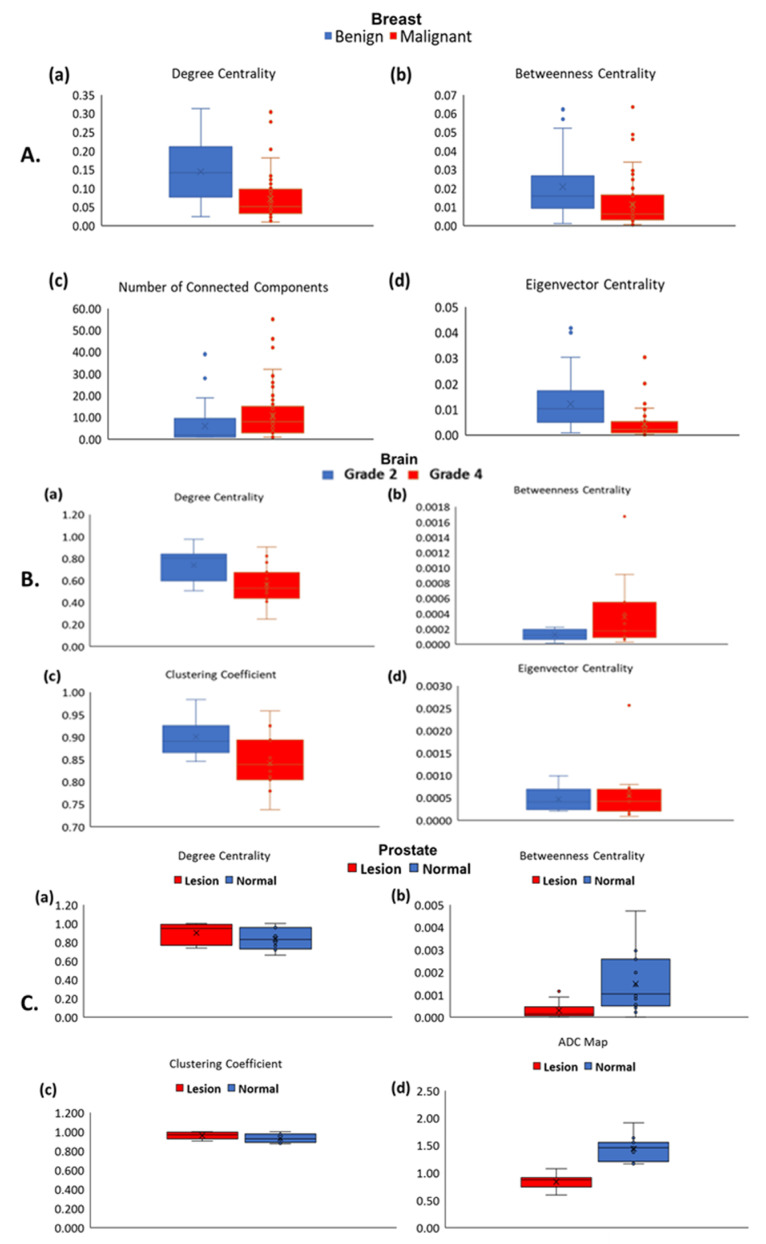
Figure 3.
Box Plots of the tumor connectomics metrics with mean with standard error of the mean are shown in the different cancers. (A) Breast tumor connectomics are shown for benign (blue) and malignant lesions (red) for the different graph centrality and the connectivity metrics computed from the breast mpMRI of (a) degree centrality, (b) betweenness centrality, (c) clustering coefficient, and (d) eigenvector centrality. (B) Brain tumor connectomics are shown for WHO Grade 2 (blue) and Grade 4 (red) lesions for the different graph metrics computed from the tumor connectome consisting of (a) degree centrality, (b) betweenness centrality, (c) clustering coefficient, and (d) eigenvector centrality obtained from tumor connectome. (C) Prostate lesion tumor connectomics are shown normal (blue) and lesion (red) tissue within the prostate based on (a) degree centrality, (b) betweenness centrality, (c) clustering coefficient, and (d) apparent diffusion coefficient (ADC) map value obtained from tumor connectome.

