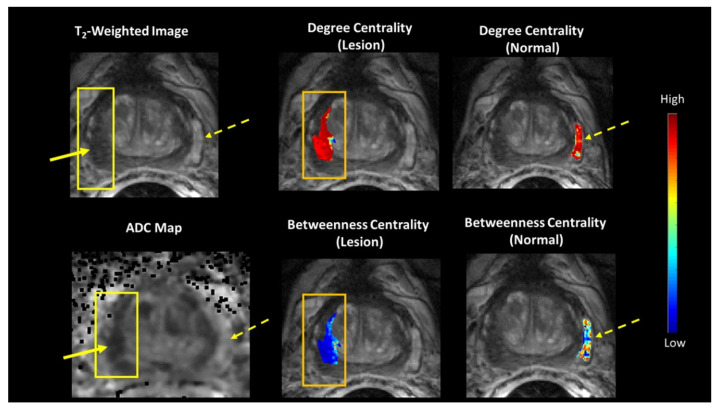
Figure 5.
(Left) A representative patient with a Gleason 7 prostate lesion and corresponding mpMRI. (Middle and Right) The tumor connectomics framework (TCF) demonstrating the betweenness and degree centrality maps overlaid on normal (dotted yellow arrow) and lesion (solid yellow arrow) tissue corresponding with the T2-weighted image and Apparent Diffusion Coefficient (ADC) map.

