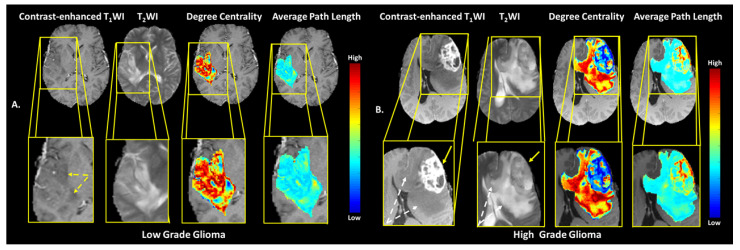
Figure 7.
Examples of the brain MRI from the BRATS validation data set. (A) A right insular and superior temporal lobe low grade oligodendroglioma (yellow arrows) and the corresponding degree centrality and average path length maps overlaid on postcontrast T1 -weighted anatomic images. (B) A WHO Grade 4 left frontal lobe glioblastoma with the TCF maps of the metrics degree centrality and average path length overlaid on the postcontrast T1-weighted anatomic images displaying the tumor. The nonenhancing T2 -hyperintense peritumoral edema is shown by the dotted white arrows in the Grade 4 lesion.

