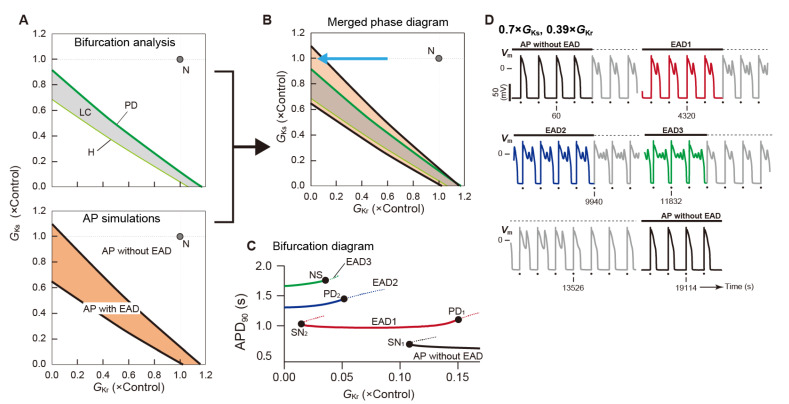
Figure 10.
Bifurcation phenomena and action potential behaviors observed in the Kurata model [112] of a human ventricular myocyte. (A) A two-parameter bifurcation diagram on the (GKr, GKs)-parameter plane (top) obtained using MATCONT [154] and a phase diagram (bottom) obtained by AP simulations. The maximum conductances of the rapid (GKr) and slow (GKs) components of delayed rectifier K+ channel currents are expressed as normalized values, i.e., ratios to the control values. In the two-parameter bifurcation diagram (top), the symbols H and PD represent the loci of parameter sets that cause the Hopf bifurcation of an equilibrium point and period-doubling bifurcation of a limit cycle (LC), respectively. The gray region indicates the area of parameters in which a stable LC can be observed. On the other hand, in the phase diagram (bottom), the orange and white regions represent parameter regions in which an AP with and without EAD, respectively, can be observed in the Kurata model. The gray point with the symbol N indicates the control condition with the normal GKr and GKs. (B) A merged phase diagram. (C) A one-parameter bifurcation diagram of APD at 90% repolarization (APD90) in each AP response as a function of GKr; see the blue arrow in panel (B), which indicates the change in GKr with the fixed normal GKs (1). The solid and dashed lines in (C) represent stable and unstable AP responses, respectively. SN: saddle-node bifurcation; EAD1–3: AP with 1–3 EAD(s); PD: period-doubling bifurcation. NS: Neimark–Sacker bifurcation. (D) An example of tetra-stable AP dynamics in the Kurata model at 0.39 × GKr with 0.70 × GKs. Colored and grey lines indicate the steady-state and transient responses, respectively. Dots indicate the application of current pulses. Pacing cycle length = 2 s. Each panel was modified from [85,130].

