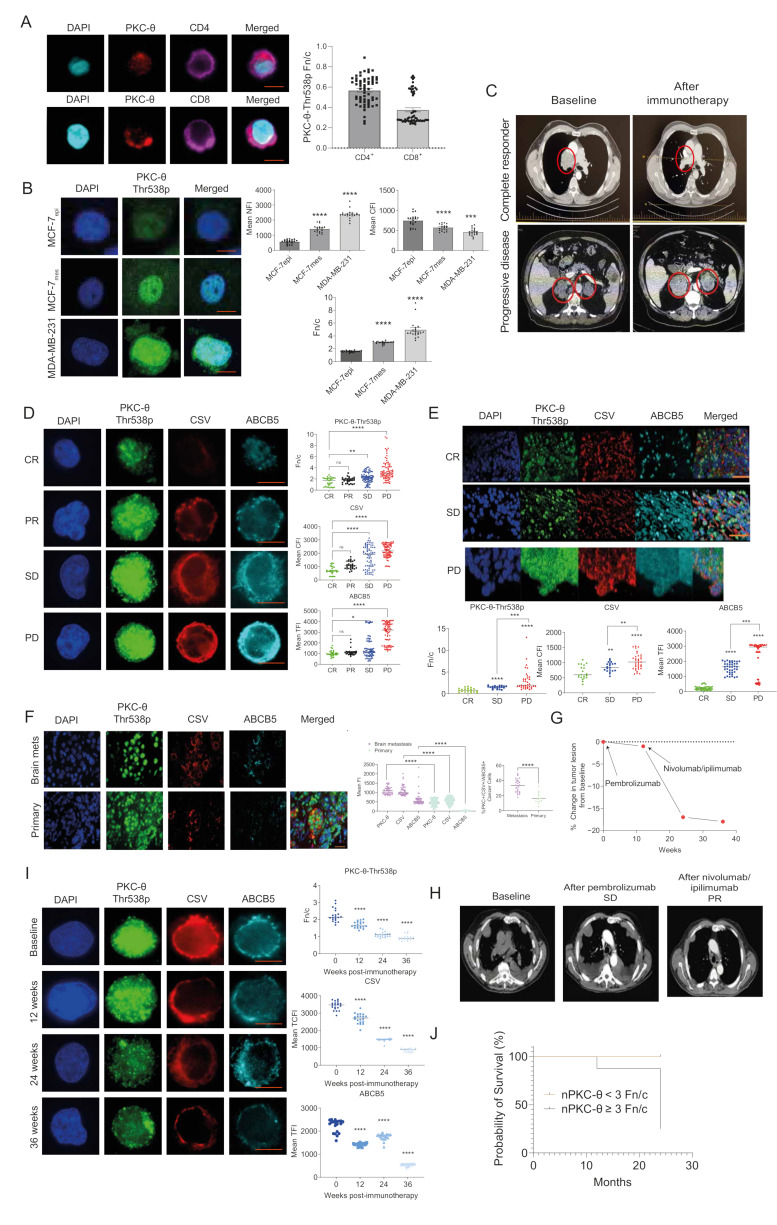
Figure 1.
nPKC-θ signatures are enriched in CTCs and metastatic tissues and are associated with poor patient survival in immunotherapy-resistant disease. (A) Immunohistofluorescence analysis of PKC-θ expression in CD4+ and CD8+ T cells isolated from healthy donor liquid biopsies. Bar/dot plots show the Fn/c (nuclear to cytoplasmic ratio) of PKC-θ phosphorylated at threonine 568 (PKC-θ-Thr568p). A score below 1 indicates cytoplasmic bias. Data are from three separate patients, n ≥ 20 cells per patient. Representative images are shown for each dataset. PKC-θ-Thr568p (red); CD8/CD4 (purple), and DAPI (cyan) were used to visualize expression and nuclei; scale bar represents 10 µM. (B) Immunohistofluorescence analysis of PKC-θ expression in human MCF-7 inducible model (MCF-7-IM) and MDA-MB-231 breast cancer cells. Human MCF-7 epithelial cells (MCF-7epi) were activated with PMA to induce EMT and generate MCF-7 mesenchymal-like (MCF-7mes) breast cancer cells. Bar graphs show the mean nuclear fluorescence intensity (NFI), cytoplasmic fluorescence intensity (CFI), and Fn/c for PKC-θ-Thr568p, n ≥ 20 cells per group. Representative images are shown for each dataset. PKC-θ-Thr568p (green) and DAPI (blue) were used to visualize nuclei. Scale bar represents 10 µM. (C) Contrast-enhanced CT scans of tumors in CR and PD metastatic melanoma patients at baseline and 12 weeks after treatment with immunotherapy (nivolumab). Red circles indicate tumor lesions. Tumor lesions are reduced in CR compared with baseline, while PD shows increased tumor burden. (D) Dot plot quantification of PKC-θ-Thr568p, CSV, and ABCB5 fluorescence intensity in circulating tumor cells (CTCs) isolated from immunotherapy-responsive (CR, partial response (PR)) or resistant (stable disease (SD), PD) melanoma patients defined using RECIST 1.1 criteria. The Fn/c for PKC-θ-Thr568p, mean CFI for CSV, and mean TFI for ABCB5 were quantified using ASI digital pathology. Representative images are shown for each cohort (six patients were profiled per cohort, n ≥ 20 cells per group); scale bar represents 10 µM. (E) Dot plot quantification of PKC-θ-Thr568p, CSV, and ABCB5 fluorescence in FFPE sections of primary melanomas from patients (n = 18 patients) with CR, SD, or PD. The Fn/c for PKC-θ-Thr568p, mean CFI for CSV, and mean TFI for ABCB5 were quantified by ASI digital pathology (n ≥ 40 cells per patient sample, four samples per patient). Representative images for each dataset are shown, scale bar represents 30 µM. (F) Dot plot quantification of PKC-θ-Thr568p, CSV, and ABCB5 fluorescence intensity in FFPE sections from breast cancer brain metastases (n = 30 patients) and primary breast cancer biopsies (n = 15 patients). The Fn/c for PKC-θ-Thr568p, mean CFI for CSV, and mean TFI for ABCB5 were quantified by ASI digital pathology (n > 40 cells per patient sample). Representative images for each dataset are shown (top); scale bar represents 30 µM. (G) Percent change in tumor lesion from baseline for a single patient with metastatic melanoma (Patient D) who was resistant to first-line treatment with pembrolizumab and displayed PD (baseline, 12 weeks) as defined by RECIST 1.1 criteria but subsequently responded to second-line nivolumab and ipilimumab to show a CR (24 weeks, 36 weeks). (H) CT scan showing overall tumor burden in Patient D at baseline, SD, and PR (partial response). (I) Mesenchymal protein expression (PKC-θ-Thr568p, CSV, and ABCB5) was profiled in CTCs isolated from Patient D at 0 (baseline) and 12-, 24-, and 36-weeks post-immunotherapy. The Fn/c for PKC-θ-Thr568p, mean CFI for CSV, and mean TFI for ABCB5 were determined by ASI Digital Pathology. Representative images for each dataset are shown (n ≥ 20 cells per group); scale bar represents 10 µM. (J) Metastatic melanoma patients (n = 18 patients) were scored for the Fn/c of PKC-θ from four liquid biopsies over 12 months, with Fn/c categorized as <3 or ≥3 (Fn/c >1 indicates nuclear bias, whereas <1 indicates cytoplasmic bias). These patients were tracked for an additional two years (total 36 months), and their survival data are plotted as Fn/c <3 or ≥3. Statistical significance is denoted by ns (not significant), * p ≤ 0.05, ** p ≤ 0.005, *** p ≤ 0.0005, and **** p ≤ 0.0001.

