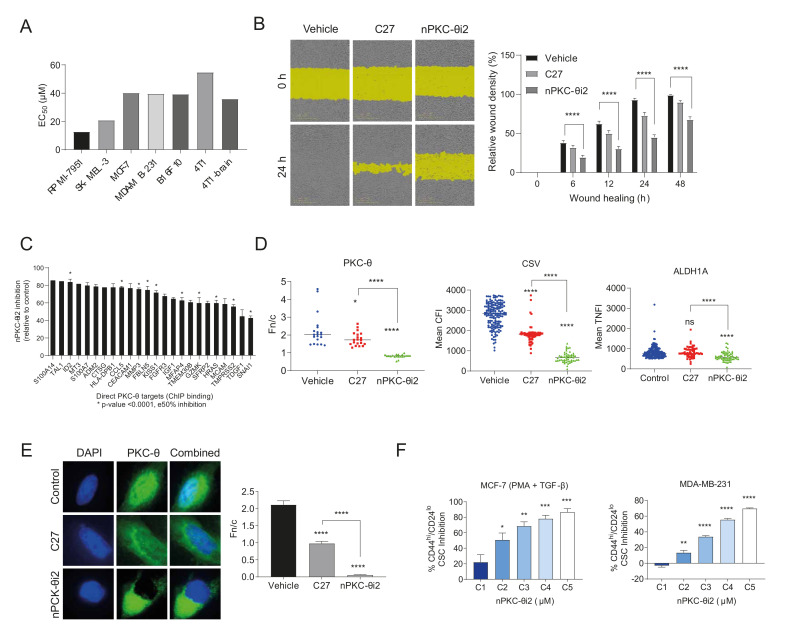
Figure 4.
nPKC-θi2 targets CSC signatures and mesenchymal pathways in metastatic and resistant cancer cell lines. (A) WST proliferation assay in melanoma (RPMI-7951, SK-MEL-3), breast cancer (MDA-MB-231), and immunotherapy-resistant (4T1, 4T1 brain clone, and B16F10) cancer cell lines. Cells were treated with nPKC-θi2 for 72 h before addition of WST reagent. Absorbance was measured at 450 nm. (B) Scratch wound assay in MDA-MB-231 breast cancer cells treated with vehicle, C27 (7.5 µM), or nPKC-θi2 (25 µM). Wound healing images were acquired by real-time imaging using the IncuCyte Zoom live cell analysis system every 6 h for 24 h. Relative wound density (%) was analyzed using IncuCyte Zoom software. One-way ANOVA was used to determine statistical significance. ns (not significant) p > 0.05; * p ≤ 0.05; ** p ≤ 0.01; *** p ≤0.001; **** p ≤ 0.0001. (C) RNA isolated from MDA-MB-231 murine tumors treated with nPKC-θi2 was analyzed using the NanoString pan-cancer panel. * indicates direct PKC-θ binding targets determined by overlaying NanoString data with ChIP sequencing data from PKC-θ enriched MDA-MB-231 samples. (D) Dot plot quantification of PKC-θ-Thr568p, CSV, and ALDH1A fluorescence intensity in the 4T1 TNBC brain cancer clone treated with vehicle, C27 (5 µM), or nPKC-θi2 (25 µM). The Fn/c for PKC-θ-Thr568p, mean CFI for CSV, and mean NFI for ALDH1A were determined by immunohistofluorescence analysis. n ≥ 20 cells per group. (E) Dot plot quantification of PKC-θ-Thr568p in MDA-MB-231 brain cancer clone cells treated with vehicle, C27 (5 µM) or nPKC-θi2 (25 µM). The Fn/c for PKC-θ-Thr568p was determined by immunohistofluorescence analysis. The Mann–Whitney test was used to determine statistical significance. ns (not significant) p > 0.05; * p ≤ 0.05; ** p ≤ 0.01; *** p ≤ 0.001; **** p ≤ 0.0001. (F) FACS plot of % CD44hi/CD24lo CSC inhibition in mesenchymal-like MCF-7 cells activated with PMA and TGF-β and MDA-MB-231 breast cancer cells treated with nPKC-θi2 1 µM (C1), 5 µM (C2), 25 µM (C3), 50 µM (C4), and 100 (C5) µM relative to their respective untreated control cells.

