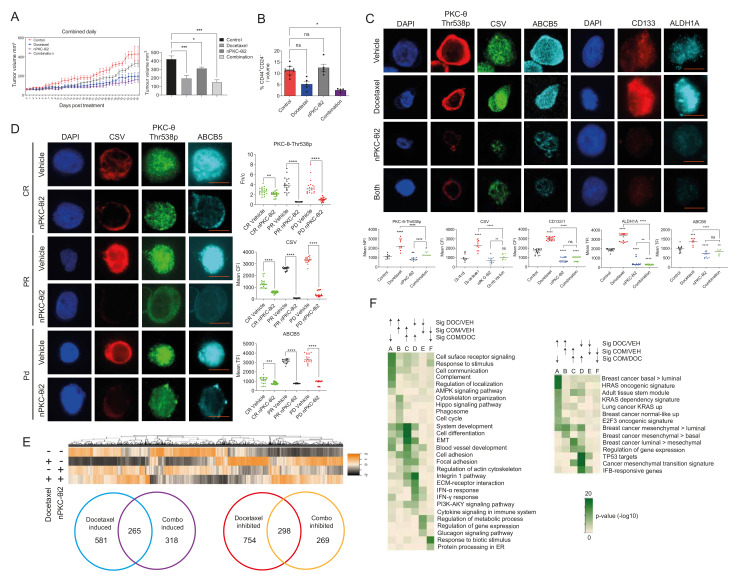
Figure 5.
Impact of the novel PKC-θ inhibitor on tumors in a TNBC xenograft model and CTCs from melanoma patients. (A) Tumor volume in MDA-MB-231 mouse-bearing tumors treated with vehicle control, docetaxel (4 mg/kg), nPKC-θi2 (40 mg/kg), or both (docetaxel given 3 times, 1 week apart and nPKC-θi2 given daily for 5 weeks). Tumor volumes were measured daily for each mouse. Each data point represents a single mouse (n = 4 mice per group). (B) Percent CD44hi/CD24lo CSC cells in total tumor in the MDA-MB-231 mouse model. (C) Immunofluorescence microscopy of tumor cells from MDA-MB-231 TNBC mice treated with nPKC-θi2 in combination with docetaxel showing that nPKC-θi2 inhibits the fluorescence intensity of PKC-θ and key stem cell niche markers CD133, ALDH1A, and ABCB5 and mesenchymal marker CSV. (D) CTCs were isolated from melanoma patient liquid biopsies (CR = complete response, PR = partial response, PD = progressive disease) and were pre-clinically treated with either vehicle control or nPKC-θi2. Samples were fixed and immunofluorescence microscopy performed on these cells with primary antibodies targeting CSV, PKC-θ, and ABCB5. Representative images for each dataset are shown. Graph represents the TCFI values for CSV, NFI for PKC-θ, and TFI for ABCB5 measured using ImageJ to select the nucleus minus background (n ≥ 20 cells/sample). (E) Heatmap of tumor transcriptomes using all significant genes together with a Venn diagram comparison of genes induced by docetaxel/combination therapy or inhibited by docetaxel/combination therapy relative to vehicle control and the overlap between these groups. (F) Heat map of enriched pathways in gene sets induced relative to vehicle control with comparison of geneset pathways induced by docetaxel (DOC) or docetaxel and nPKC-θi2 (COM). Statistical significance is denoted by ns (not significant), * p ≤ 0.05, ** p ≤ 0.005, *** p ≤ 0.0005, and **** p ≤ 0.0001.

