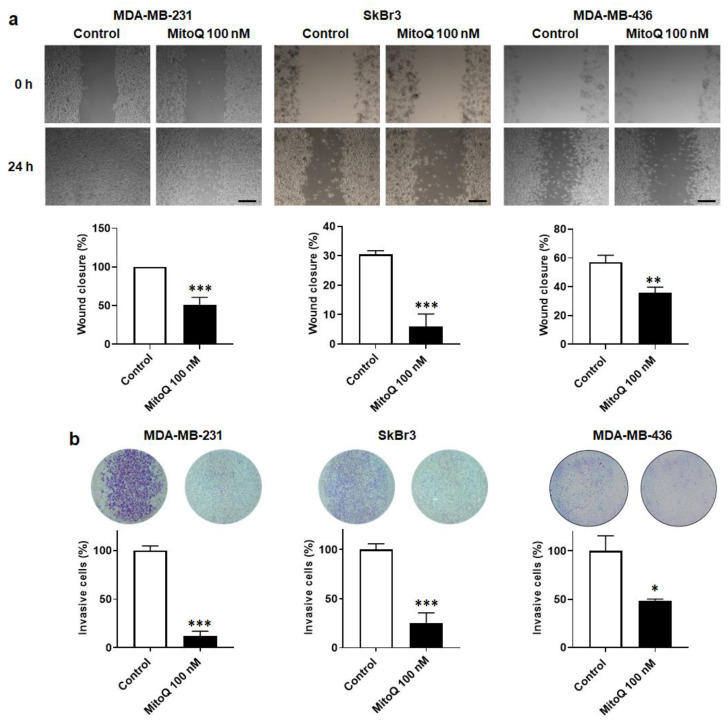
Figure 5.
MitoQ represses human breast cancer cell migration and invasion. Cells were treated for 48 h ± MitoQ (100 nM). (a) MDA-MB-231 (left, n = 6), SkBr3 (middle, n = 3–8) and MDA-MB-436 (right, n = 10–13) cancer cell migration over 24 h was determined using a scratch assay. Representative pictures are shown on top and quantification graphs on the bottom. Bars = 50 µm. (b) MDA-MB-231 (left, n = 3), SkBr3 (middle, n = 3) and MDA-MB-436 (right, n = 3) cancer cell invasion was quantified in a Boyden chamber assay. Representative images are shown together with overnight invasion data. All data are shown as means ± SEM. * p < 0.05, ** p < 0.01, *** p < 0.001 compared to control; by Student t-test (a,b).

