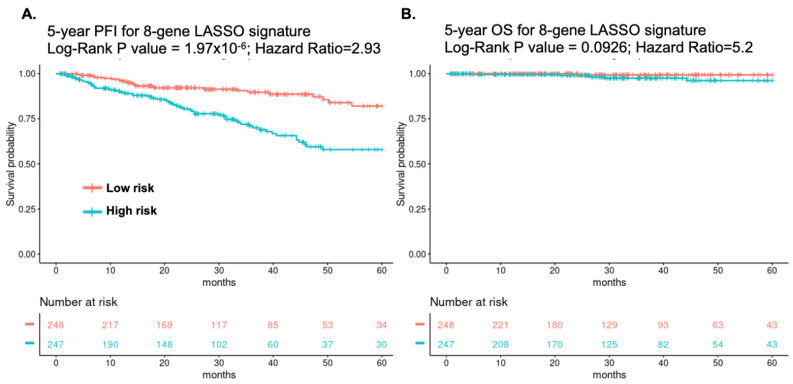
Figure 2.
Progression-free interval (PFI) and overall survival (OS). Kaplan–Meier curves for (A) 5-year progression-free interval and (B) 5-year overall survival of the 8-gene signature. Patients were dichotomized into the “Low risk” group and the “High risk” group according to the 8-gene signature scores. The number of patients of the two risk groups in different following time in month were shown in the bottom tables of KM plots, respectively.

