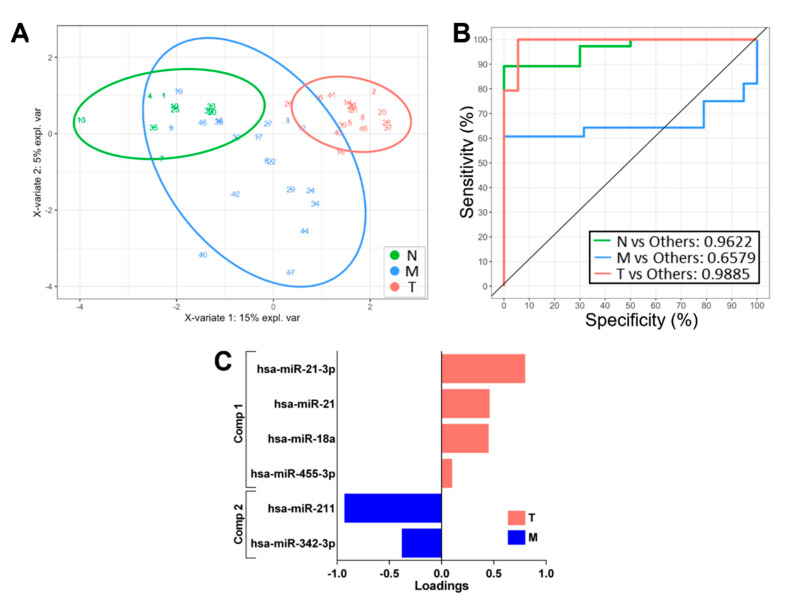
Figure 3.
Classification performance of a sPLS-DA-derived miRNA expression signature. (A) Two-dimensional sample plots for the 3 groups with confidence ellipse plots. (B) Corresponding ROC curve. (C) Loading plots for multinomial N vs. M vs. T classifiers showing the contribution of each miRNA to the signature.

