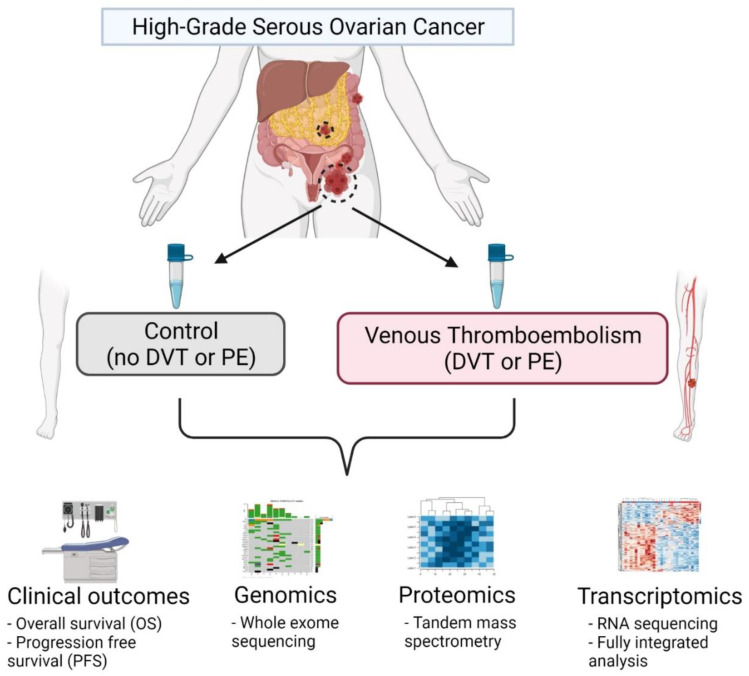
Figure 1.
Schema of multi-omics analysis in HGSC patients with and without concurrent VTE. In this analysis, a total of 32 samples (n = 16 for both control and VTE groups) were obtained from the MD Anderson Cancer Center Ovarian Cancer Moon Shot database and subjected to a multi-platform omics analysis including whole exome sequencing (WES), quantitative mass spectrometry-based proteomics, and transcriptomics with RNA sequencing and a full integrated analysis incorporating clinical data and outcomes from the electronic medical record. Figure created with BioRender (https://app.biorender.com/illustrations/612d1ad2a3e2c500a5b6b6c3, accessed on 23 October 2021).

