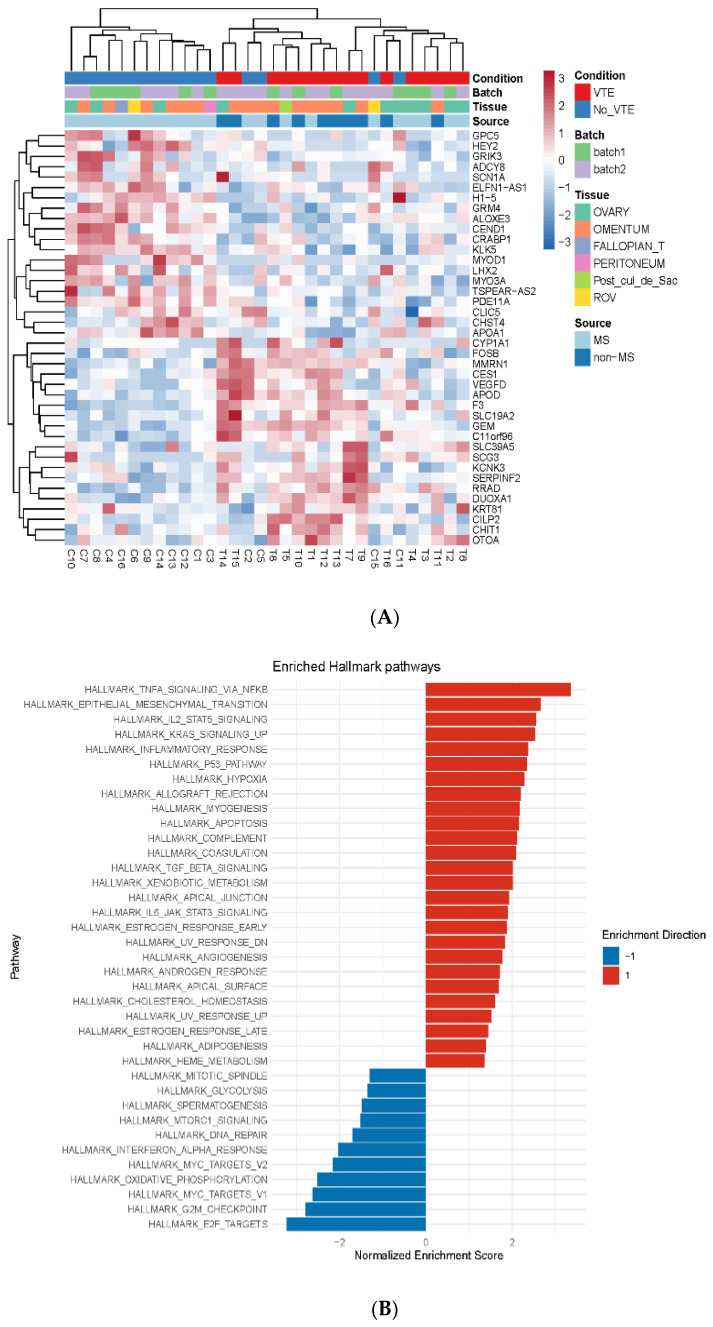
Figure 2.
Differentially expressed genes and metabolic pathways in HGSC patients in VTE and control groups. (A) Heat map of the top 40 altered transcripts in HGSC tumor tissue in patients with and without venous thromboembolism (VTE). Abbreviations: Fallopian_T, fallopian tube; Post_cul_de_sac, posterior cul de sac; ROV, right ovary; MS, moonshot cancer database; non-MS, non-moonshot cancer database. (B) Gene set enrichment analysis (GSEA) identifying enriched pathways for VTE compared to non-VTE controls. Red indicates enhanced enrichment; blue indicates decreased enrichment.

