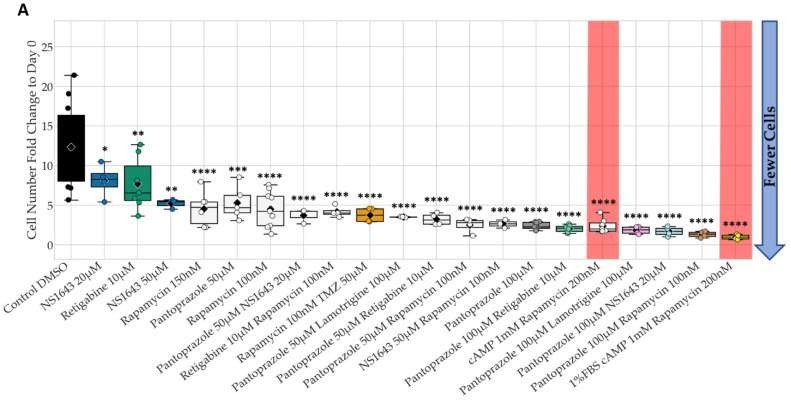
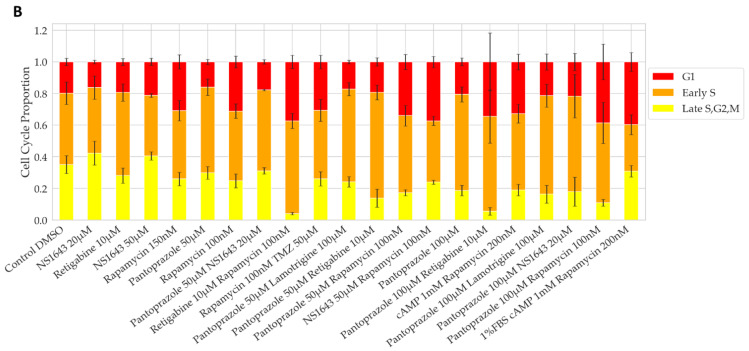
Figure 1.
NG108-15 Proliferation is Significantly Lowered with Bioelectric Treatment and Show Changes in Cell Cycle Ratios. (A) Fold change to start cell counts (cells at day 6/cells at day 0) after 6 days of treatment. Low values indicate less cell growth. Colors indicate treatments followed up for further analysis, and hues represent concentrations and combinations. Red shaded treatments correspond to positive controls that cannot be used clinically. Only treatments with significant values are shown out of 33 treatments compared to DMSO control. ****: q < 0.0001 ***: q < 0.001, **: q < 0.01, *: q < 0.05 (one-way ANOVA with FDR post hoc analysis n > 3 biological replicates). (B) FUCCI cell cycle data at day 6. Increased red and orange fractions indicate cell cycle arrest at G1 or G1 to S transition.


