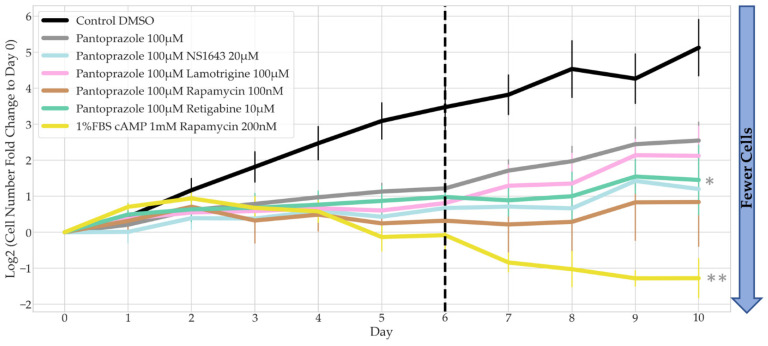
Figure 3.
Recovery Test of Bioelectric Treatments in Combination with Pantoprazole in NG108-15 FUCCI Cells. The log2 of the fold change in cell counts to Day 0 were recorded for 10 days. Dotted line marks the day on which drug treatment was removed and replaced with control media (n > 3 biological replicates). Combination drug treatment slopes from Day 6 to Day 10 were compared to pantoprazole alone, significance is shown with grey stars next to the corresponding line **: p < 0.01, *: p < 0.05 (one-way ANOVA with Dunnett post hoc analysis n > 3 biological replicates).

