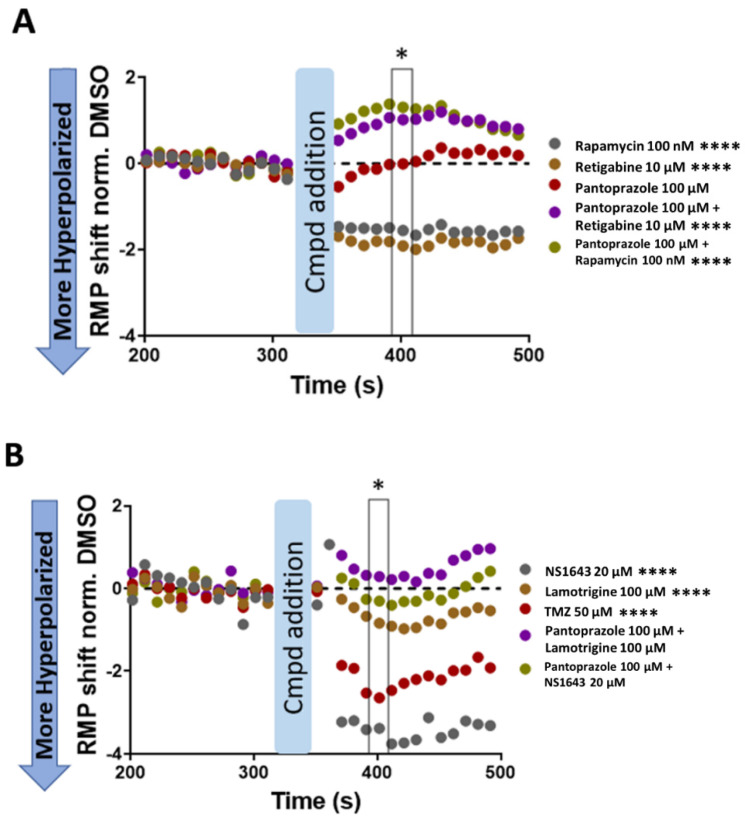
Figure 7.
Resting Membrane Potential Changes Caused by Treatments in NG108-15 FUCCI Cells. The change in resting membrane potential is normalized to DMSO control. The negative values represent an increase in hyperpolarization. (A,B) were conducted on different days. There were n = 55–63 cells per condition. Statistics were calculated for the 400 s time point (black box with star on top). Significant values shown next to legend. ****: p < 0.0001, were calculated using an ANOVA with Dunnett post hoc analysis.

