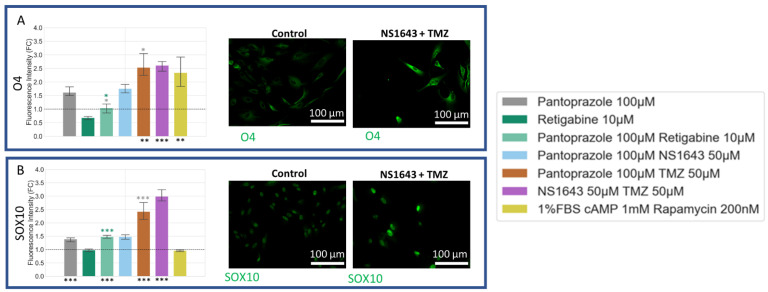
Figure 13.
Differentiation Analysis of U87 Cells Reveals that Treatments with Pantoprazole Increased Oligodendrocyte Markers after 6 days. Immunofluorescence of cells was conducted and analyzed with CellProfiler for integrated fluorescence intensity. (A) Stain of oligodendrocyte marker O4. (B) Stain of the Sry-related HMg-Box gene 10 (SOX10). Treatments corresponding to the colored bars are outlined in the figure itself. The log of the fold change in intensity was compared between single treatments and combined treatments, except the positive control, with significant values shown in the color of the treatment compared. The initial fluorescence intensities were compared to their corresponding control, with significant values shown under the bars as, ***: p < 0.001, **: p < 0.01, *: p < 0.05 (one-way ANOVA with Tukey post hoc analysis n > 3 technical replicates).

