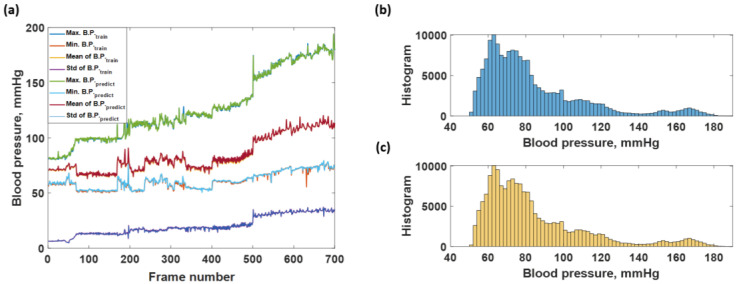
Figure 13.
Shows the (a) average max, min, mean, and standard deviation of each frame number training dataset and predicted responses; (b) histogram of blood pressure level covering in the actual training blood pressure data; and (c) histogram of blood pressure level covering in the predicted blood pressure data by using LSTM network.

