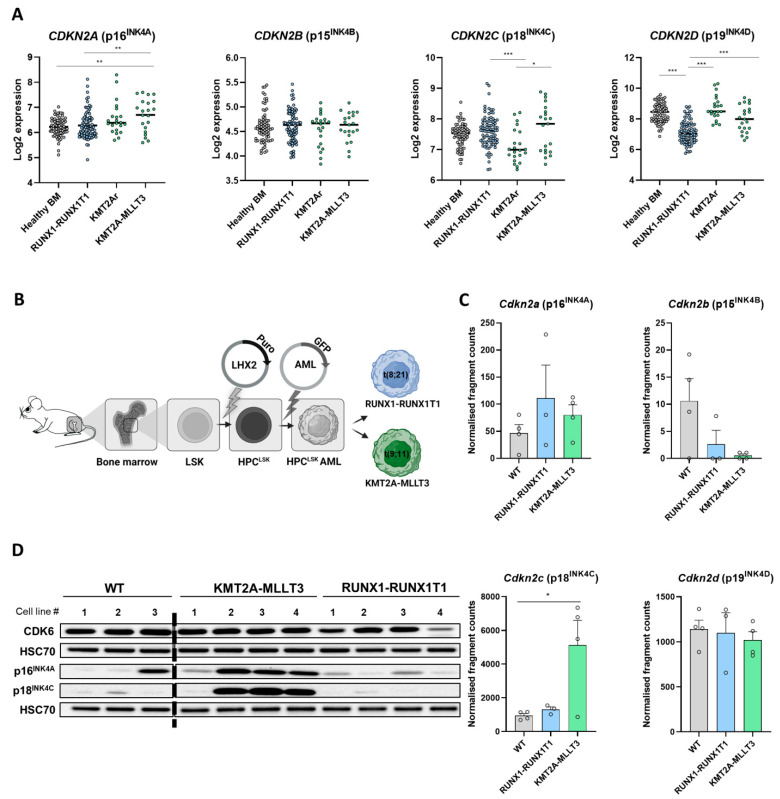
Figure 1.
INK4 protein levels differ among AML subtypes. (A) The RNA expressions of INK4 genes from human AML patient microarray datasets were analysed: healthy bone marrow, BM (n = 74); RUNX1-RUNX1T1, t(8;21) (n = 86); KMT2A rearrangements, KMT2Ar (11q23) (n = 22); KMT2A-MLLT3, t(9;11) (n = 21). The KMT2Ar contained no KMT2A-MLLT3 samples. The line represents the median; * FDR < 0.05; ** FDR < 0.01; *** FDR < 0.001. (B) A schematic representation of experimental procedure. Murine bone marrow cells were isolated and immortalised with an LHX2 plasmid vector for generating HPCLSK lines. HPCLSK cells were then transformed by the integration of human RUNX1-RUNX1T1 t(8;21) (GFP) or KMT2A-MLLT3 t(9;11) (Venus) plasmid vectors. (C) The RNA expression of INK4 genes in the HPCLSK WT (n = 4), RUNX1-RUNX1T1+ (n = 3) and KMT2A-MLLT3+ (n = 4) cells taken from a RNA sequencing dataset: * p = 0.0299. (D) The immunoblot of the different biological replicates of HPCLSK WT (n = 3), KMT2A-MLLT3+ (n = 4) and RUNX1-RUNX1T1+ (n = 4) cells detecting CDK6, p16INK4A and p18INK4C. HSC70 served as a loading control. The uncropped immunoblots are depicted in Figure S5 and the densitometry quantification is presented in Figure S1D.

