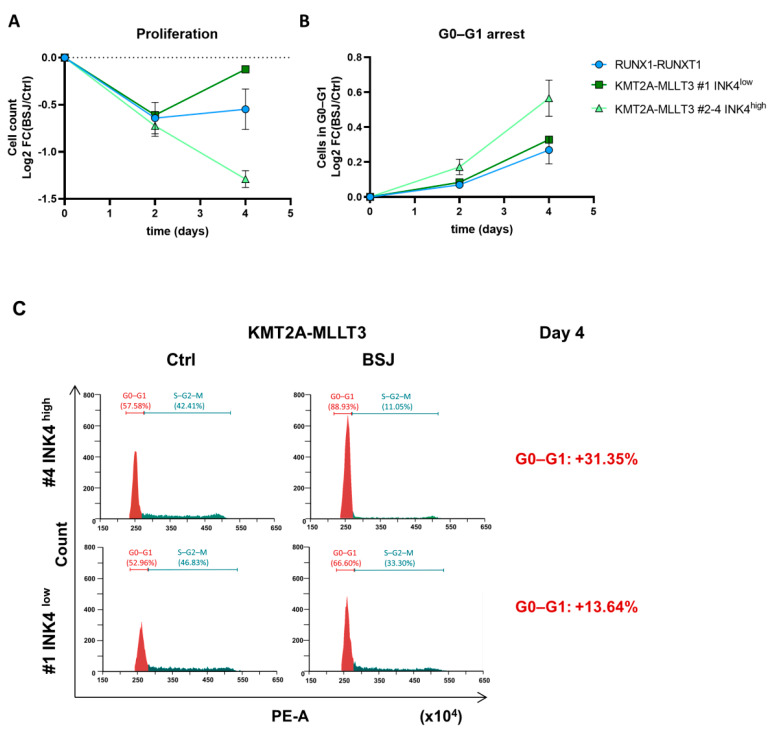
Figure 2.
Delayed cell cycle re-entry in AML cells with high INK4 levels after BSJ treatment. (A) The flow cytometry analysis of RUNX1-RUNX1T1+ (n = 3), KMT2A-MLLT3+ INK4low (n = 1) and INK4high (n = 3) cells. The cell number measurements are depicted as the log2 FC (BSJ/control) calculation after two and four days of treatment with 3 µM of BSJ. (B) The flow cytometry analysis of cell cycle phases using propidium iodide (PI). The G0–G1 phase of RUNX1-RUNX1T1+ (n = 3), KMT2A-MLLT3+ INK4low (n = 1) and INK4high (n = 3) cells is depicted as the log2 FC (BSJ/control) calculation after two and four days of treatment with 3 µM of BSJ. (C) The exemplary cell cycle profiles that were analysed by the PI staining of KMT2A-MLLT3+ #4 INK4high (top panel) and #1 INK4low cells (bottom panel) at day four of treatment with 3 µM of BSJ (right-hand panel) or vehicle control (left-hand panel). The gating strategy is indicated in the histogram plots. The change of the percentage of cells in the G0–G1 phase after BSJ treatment is highlighted on the right-hand side of the graphs.

