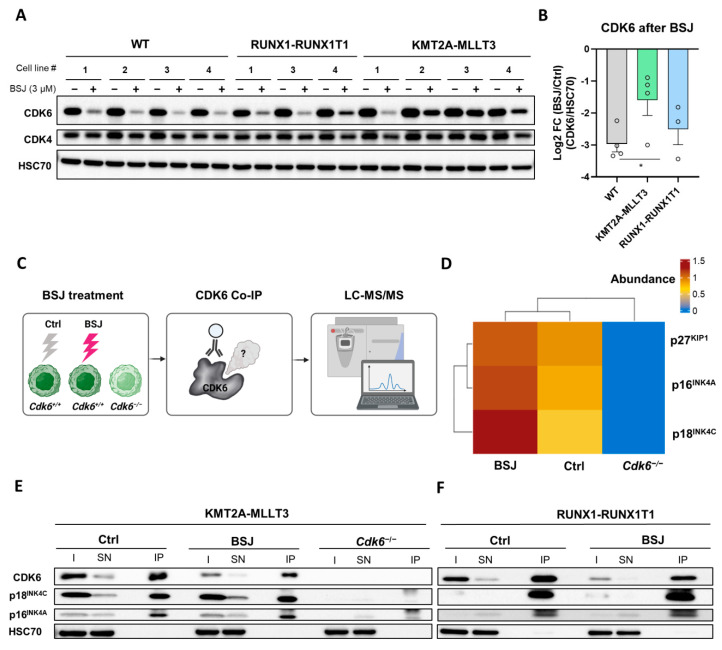
Figure 3.
CDK6-INK4 complexes were enriched after BSJ treatment. (A) The immunoblot for the CDK6 and CDK4 levels of HPCLSK WT (n = 4), RUNX1-RUNX1T1+ (n = 3) and KMT2A-MLLT3+ (n = 4) cells treated with 3 µM of BSJ or vehicle control for four days. HSC70 served as a loading control. The original, uncropped immunoblots are depicted in Figure S5. The densitometry is depicted in (B) and Figure S3A. (B) The log2FC (BSJ/control) calculation of the immunoblot densitometry quantification from (A) (CDK6/HSC70): * p < 0.05. (C) A schematic representation of the experimental procedure. KMT2A-MLLT3+ cells were treated with 3 µM of BSJ or vehicle control for 24 h. A KMT2A-MLLT3+ Cdk6−/− cell line was used as the negative control. Cell protein lysates were co-immunoprecipitated (Co-IP) with an anti-CDK6 antibody and complexes were analysed by LC-MS/MS to identify any CDK6 interaction partners that were present in the untreated sample or were enriched after BSJ treatment. (D) A heat map depicting the abundances of INK4 and KIP1 proteins in the BSJ and control samples. The enrichments of the proteins over the background were calculated as the log2 fold changes (log2FC) of the normalised abundances of the control or BSJ over the Cdk6−/−. (E) An anti-CDK6 Co-IP was performed on KMT2A-MLLT3+ cell lysates from 24 h treatments with 3 µM of BSJ or vehicle control. Cdk6−/− cells served as the negative control. The input (I), supernatant (SN) and immunoprecipitate (IP) fractions were immunoblotted for CD K6, p18INK4C and p16INK4A. HSC70 served as the loading control. The immunoblot densitometry quantification is depicted in Figure S3F. The original, uncropped immunoblots are depicted in Figure S5. (F) An anti-CDK6 Co-IP was performed on RUNX1-RUNX1T1+ cell lysates from 24 h treatments with 3 µM of BSJ or vehicle control. The input (I), supernatant (SN) and immunoprecipitate (IP) fractions were immunoblotted for CDK6, p18INK4C and p16INK4A. HSC70 served as the loading control. The immunoblot densitometry quantification is depicted in Figure S3G. The original, uncropped immunoblots are depicted in Figure S5.

