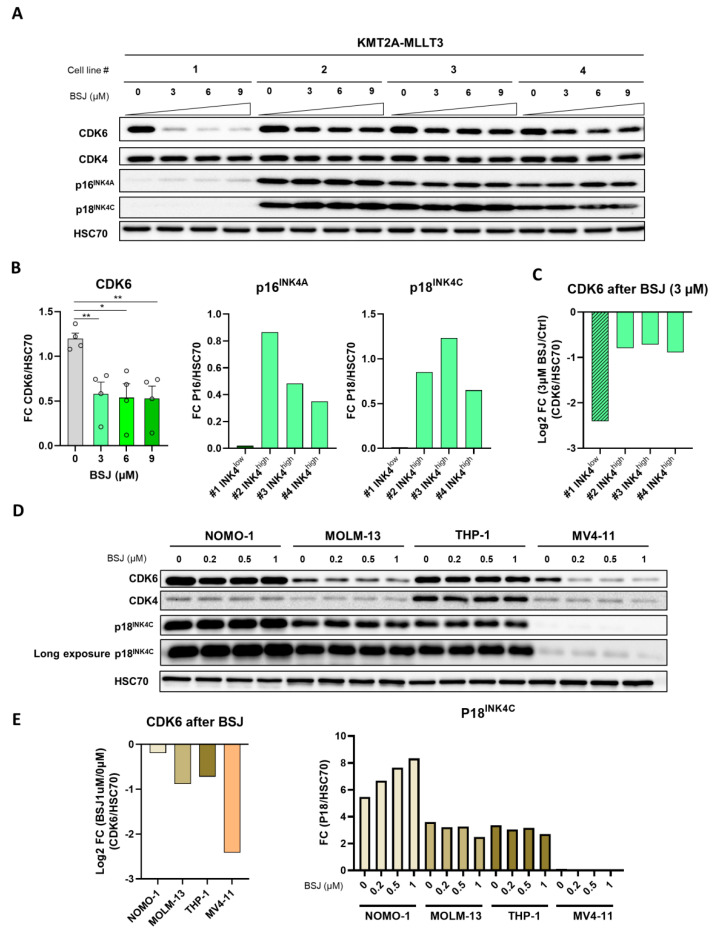
Figure 4.
BSJ efficacy predicted by INK4 levels. (A) The immunoblot for CDK6, CDK4, p16INK4A, p18INK4C and HSC70 in KMT2A-MLLT3+ cells (n = 4) treated with increasing concentrations (3 µM, 6 µM and 9 µM) of BSJ or vehicle control for four days. The original, uncropped immunoblots are depicted in Figure S5. The densitometry quantification is depicted in (B,C) and Figure S4C,D. (B) The immunoblot densitometry quantification from (A) of CDK6, p16INK4A and p18INK4C normalised to HSC70 (left) and P16INK4A and p18INK4C quantification normalised to the HSC70 of KMT2A-MLLT3 control samples grouped into INK4low and INK4high (middle and right): * p < 0.05; ** p < 0.01. The densitometry of CDK4 is depicted in Figure S4D. (C) Log2 FC (BSJ/control) calculated from the CDK6/HSC70 immunoblot quantification from the KMT2A-MLLT3+ samples grouped into INK4low and INK4high. (D) The immunoblot for CDK6, CDK4 and p18INK4C and the short and long exposure and HSC70 of human AML cell lines that were positive for KMT2A-MLLT3 (NOMO-1, MOLM-13 and THP-1) or KMT2A-AFF1 (MV4-11) and were treated with increasing concentrations of BSJ (0.2 µM, 0.5 µM and 1 µM) or vehicle control for 90 min. The original, uncropped immunoblots are depicted in Figure S5. The densitometry quantification is depicted in (E) and Figure S4E,F. (E) Log2 FC (BSJ/control) of the immunoblot densitometry quantification from (D) calculated from the human AML cell lines that were treated with 1 µM of BSJ (left). The immunoblot quantification of the p18INK4C levels normalised to HSC70 from the human AML cell lines that were treated with increasing concentrations of BSJ (0.2 µM, 0.5 µM and 1 µM) or vehicle control for 90 min and the densitometry for CDK4 and CDK6 is depicted in Figure S4E.

