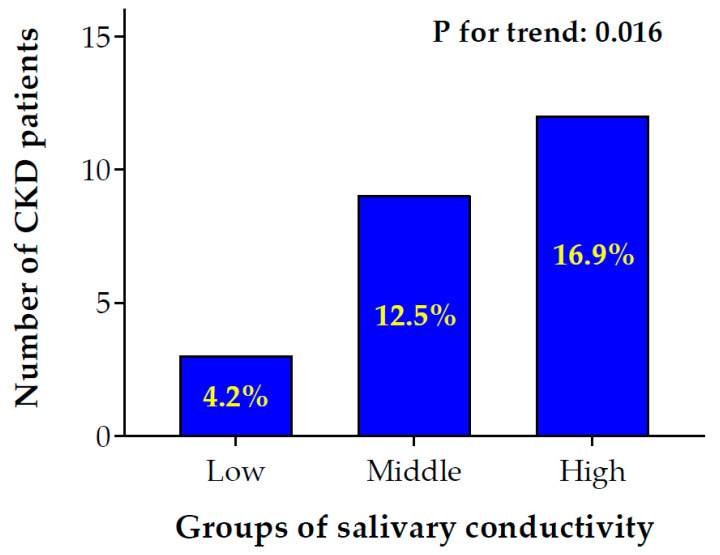
Figure 5.
Bar chart of the number of CKD patients with low to high salivary conductivity levels. Participants were separated into low, middle, and high salivary conductivity levels based on the tertials of conductivity levels (low ≤ 4.84 ms/cm; 4.84 ms/cm < middle ≤ 6.60 ms/cm; high > 6.60 ms/cm). The number and percentage of patients with CKD were shown in the bar chart (p for trend: 0.016). CKD, chronic kidney disease.

