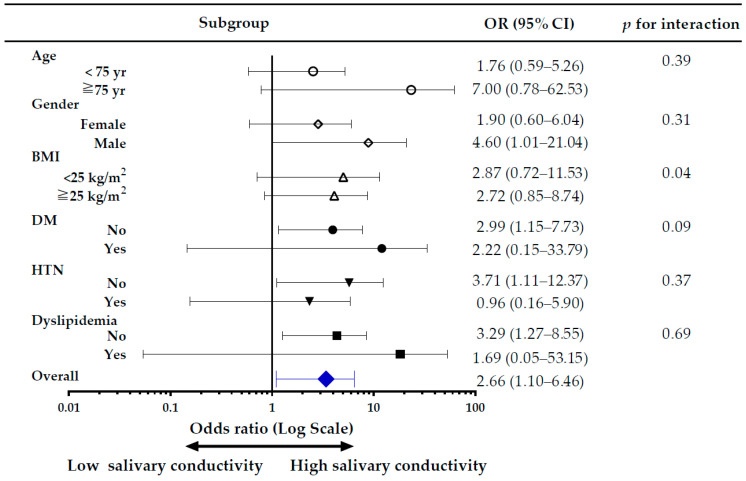
Figure 7.
Forest plot for subgroup analysis of CKD risk. The adjusted odds ratio (OR) is for the high versus low salivary conductivity group. Study subjects were divided into high and low salivary conductivity groups based on the cutoff value of the ROC curve analysis (6.59 ms/cm). BMI, body mass index; CKD, chronic kidney disease; DM, diabetes mellitus; HTN, hypertension.

