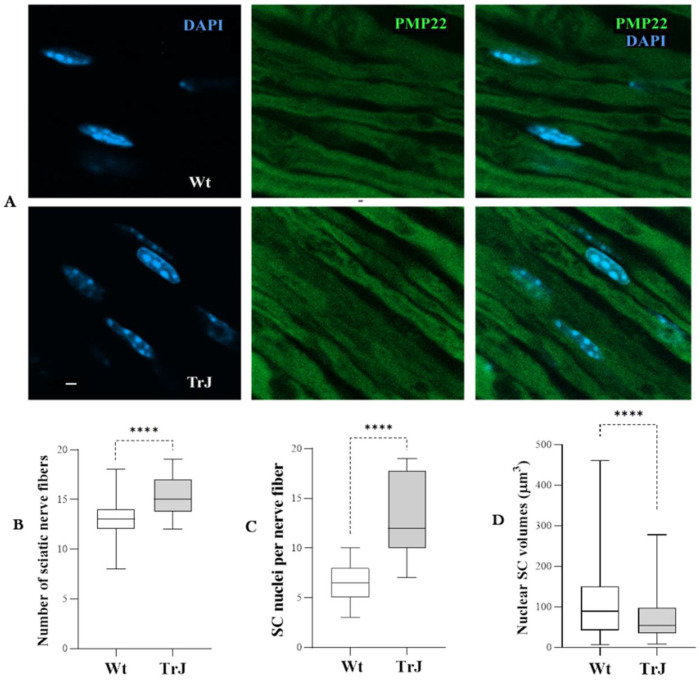
Figure 1.
Fibers and Schwann cell nuclei in Wt and TrJ sciatic nerves. (A): Confocal images of Wt and TrJ sciatic nerve fibers. (B–D): Box plots illustrating the distribution of number of fibers, and SC nuclei through the whole thickness of sections and SC nuclear volumes (µm3) of Wt and TrJ, respectively. The fibers were immunostained using anti-PMP22 (green), after epitope retrieval (70% formic acid), and counterstained with DAPI (blue). Both areas and volumes were measured on DAPI channel. Boxes enclose the data comprising between the 25th and 75th percentiles (50% of the data). The median (50th percentile) is denoted by the transversal line within each box. Differences between Wt and TrJ were examined by means of Mann–Whitney tests (**** p-Values < 0.0001). Number of panoramic images analyzed = 20 per genotype. Volumes were calculated in 150 SC nuclei per genotype. Scale bar = 2 µm. Both the fiber and SC nucleus numbers were significantly larger in TrJ than in Wt sciatic nerves, whereas SC nuclear volume was significantly smaller in TrJ than Wt mice.

