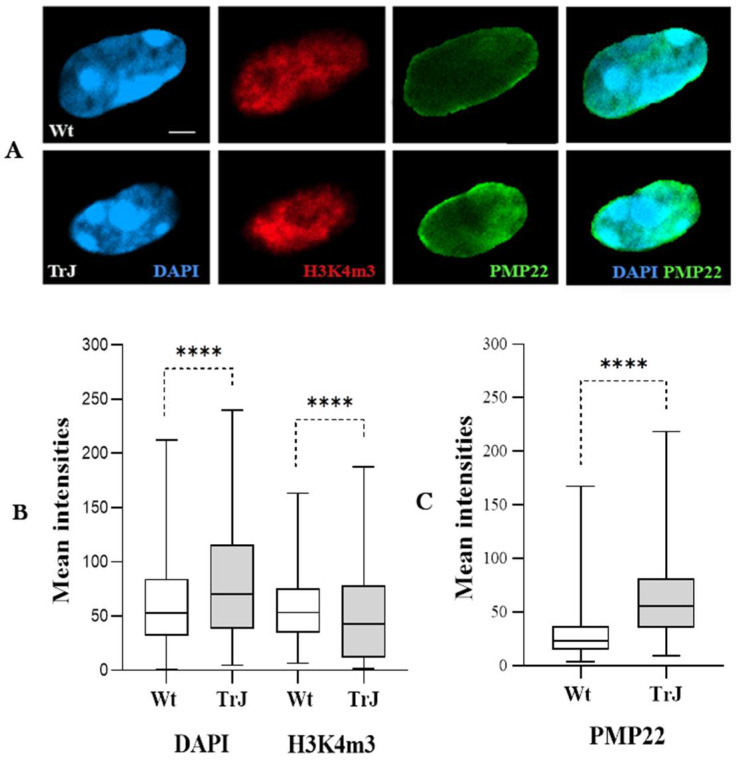
Figure 2.
DAPI, H3K4m3, and PMP22 signals in Wt and TrJ Schwann cell nuclei. (A): Confocal images of a central slice of a TrJ or Wt SC nucleus. The fibers were immunostained with anti-H3K4m3 (red) anti-PMP22 (green) antibodies, after epitope retrieval (70% formic acid), and counterstained with DAPI (blue). Box plots representing the mean intensity values (arbitrary units) of DAPI and H3K4m3 (B) and PMP22 (C) signals measured on TrJ and Wt SC nuclei. The boxes containing 50% of the data, presented the median as a transversal line within them. Differences between Wt and TrJ were verified by applying Mann–Whitney tests (**** p-Values < 0.0001) in 150 SC nuclei per genotype. Scale bar = 2 µm. Both Wt and TrJ SC nuclei express PMP22. The intensity of PMP22 was significantly higher in TrJ than in Wt. Furthermore, the overall DAPI intensity of chromatin was significantly higher in TrJ relative to Wt, but the H3K4m3 euchromatic signal intensity was significantly lower in TrJ than in Wt SC nuclei.

