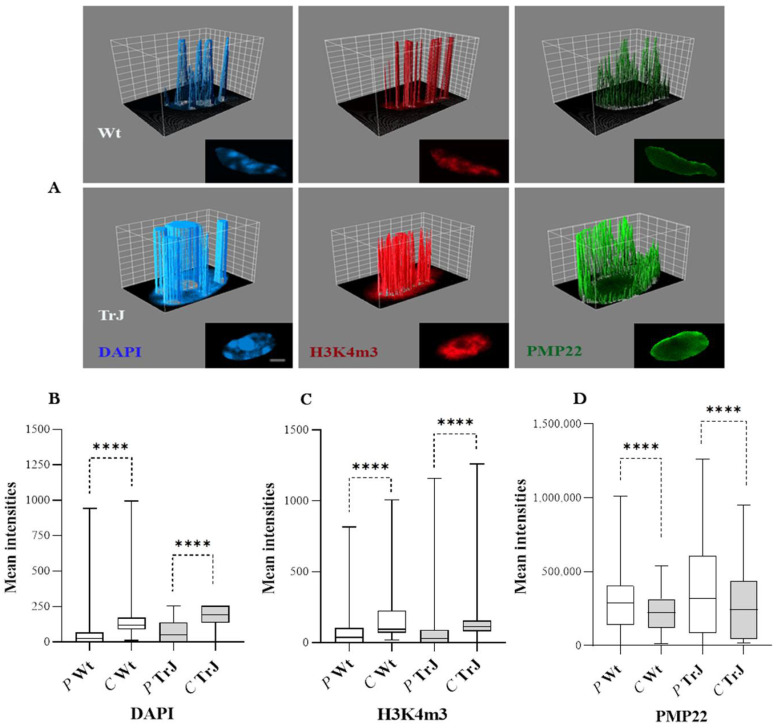
Figure 3.
Peripheral versus central distributions of DAPI, H3K4m3, and PMP22 signals in Wt and TrJ Schwann cell nuclei. (A): 3D surface plot illustrating intensity (arbitrary units) of DAPI, H3K4m3, and PMP22 signal distributions upon a central plane of each Wt or TrJ SC nucleus. The peaks correspond to nuclear regions of greatest intensity (arbitrary units). The confocal images used to perform the 3D surface plots are presented below each corresponding 3D plot. Box plots show the peripheral (P) versus central (C) distribution of (B): DAPI, (C): H3K4m3 and (D): PMP22 signals in Wt and TrJ SC nuclei. The boxes enclose 50% of the data and represent the median and 25% and 75% quartiles. Differences between peripheral versus central distribution in Wt and TrJ were verified by applying Mann–Whitney tests (**** p-Values < 0.0001) in 100 SC nuclei per genotype. Scale bar = 2 µm. The intensities of each DAPI and H3K4m3 chromatin mark significantly prevail in the central SC nuclear regions, while PMP22 signals significantly predominate in the peripheral SC nuclear areas of the Wt and TrJ genotypes.

