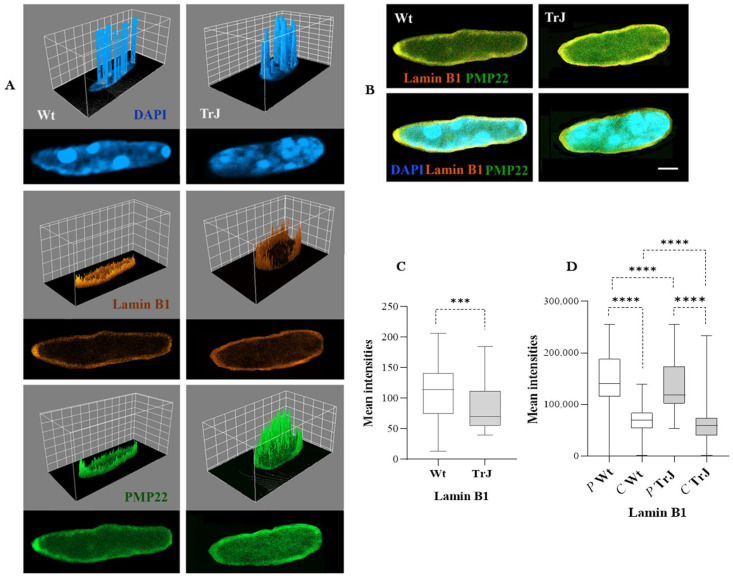
Figure 4.
Lamin B1 intensity, peripheral versus central Lamin B1 distribution, and its relationship to PMP22 in Wt and TrJ Schwann cell nuclei. (A): 3D surface plot illustrating the intensity of DAPI, Lamin B1, and PMP22 signal (arbitrary units) distributions upon a central plane of each Wt or TrJ SC nucleus. The peaks correspond to nuclear regions of the greatest intensity. The confocal images of Wt and TrJ Sc nuclei are presented below each corresponding 3D plot. (B): Merge images of Lamin B1 and PMP22 or DAPI, Lamin B1 and PMP22. (C,D): Box plot showing Lamin B1 intensities and its peripheral (P) versus central (C) distribution in Wt and TrJ SC nuclei, respectively. Median and 25% and 75% quartiles are represented in each box. Differences between peripheral versus central distribution in Wt and TrJ were verified by applying Mann–Whitney tests (p-Values: *** < 0.001, **** < 0.0001) in 100 SC nuclei per analysis and genotype. Scale bar = 2 µm. Lamin B1 fluoresces less intensely in TrJ than Wt SC nuclei and preferentially localizes to peripheral SC nuclear regions where PMP22 intensity is significantly prevalent in both Wt and TrJ mice.

