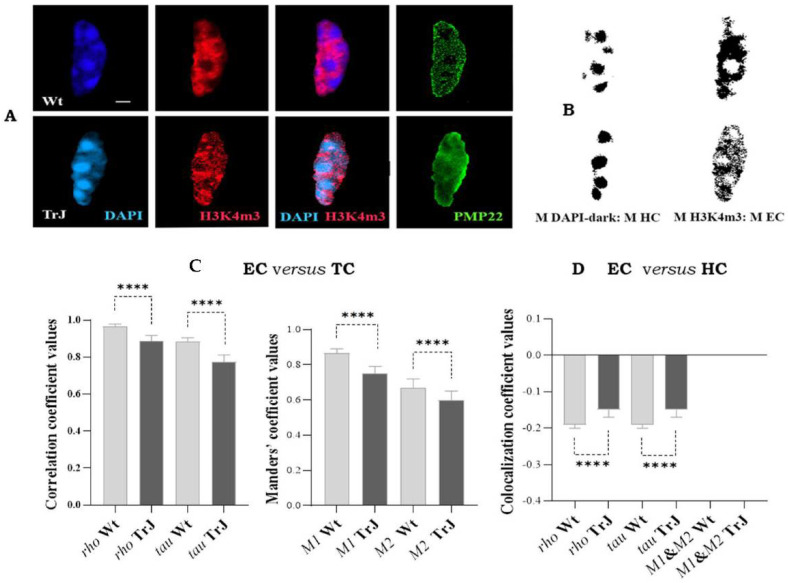
Figure 5.
Colocalization analysis of euchromatin and heterochromatin in Schwann cell nuclei. (A): Images of Wt and TrJ SC nuclei showing DAPI (blue), euchromtic H3K4m3 (red) and PMP22 (green) signals. (B): Respectively mask images of heterocromatin (M HC) and euchromatin (M EC), obtained using the threshold tool of Fiji. (C): Colocalization between euchromatin (EC) and total chromatin (TC). M1: fraction of EC (H3K4m3 signal) in TC (DAPI-light + DAPI-dark signals), and M2: fraction of TC in EC. (D): Colocalization between EC (M H3K4m3) and HC (M DAPI-dark). M1: fraction of EC (M H3K4m3) in HC (M DAPI−dark), and respectively M2: fraction of HC (M DAPI-dark) in EC (M H3K4m3). Rho and tau correlations and M1 and M2 co-occurrence coefficients were estimated employing Fiji Coloc 2 plugins with Costes p-Values > 95%. The bar diagrams illustrate the medians and 95% confidence intervals of the coefficients. Scale bar = 2 µm. Differences between Wt and TrJ were established applying Mann–Whitney tests (**** p-Values < 0.0001) in 100 SC nuclei per genotype. As expected, in both Wt and SC nuclei, EC colocalizes with TC and anticolocalizes with HC, both relationships being significantly stronger in Wt than TrJ SC nuclei.

