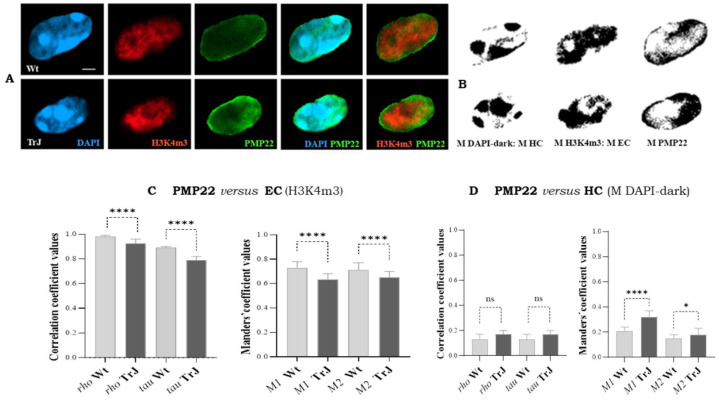
Figure 6.
Colocalization analysis of PMP22 with euchromatin and heterochromatin in Schwann cell nuclei. (A): Images of Wt and TrJ SC nuclei showing DAPI (blue), euchromtic H3K4m3 (red) and PMP22 (green) signals. (B): Respectively mask images of heterochromatin (M HC), euchromatin (M EC) and PMP22 (M PMP22, obtained using the threshold tool of Fiji. (C): Colocalization analysis between PMP22 (PMP22 signal) and euchromatin (H3K4m3 signal). M1: fraction of euchromatin in PMP22 area, and M2: fraction of PMP22 area in euchromatin. (D): Colocalization analysis between PMP22 (PMP22 signal) and heterochromatin (M HC). M1: fraction of heterochromatin in PMP22 area, and M2: fraction of PMP22 area in heterochromatin. (B,C): Bar diagrams representing, by means of median and 95% confidence intervals, the distributions of rho and tau correlations and M1 and M2 co-occurrence coefficients, respectively. Rho, tau, M1 and M2 were obtained employing Fiji Coloc 2 plugins with Costes p-Values > 95%. The bar diagrams represent the medians and 95% confidence intervals of the coefficients. Differences between Wt and TrJ were analyzed applying Mann–Whitney tests (p-Values: * < 0.01 and **** < 0.0001) in 100 SC nuclei per genotype. Scale bar = 2 µm. Correlations and co-occurrence coefficient values denote that PMP22 colocalize with EC and much lesser with HC in both Wt and TrJ SC nuclei. However, there is more colocalization with EC in Wt and more colocalization with HC in TrJ.

