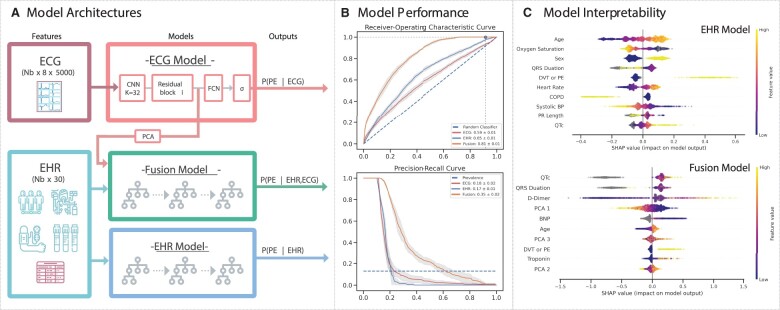
Figure 2.
Modelling overview, performance, and interpretability. (A) The electrocardiogram model, which is a convolutional neural network with residual connections, trains and infers pulmonary embolism likelihood using 10-s long waveform from 8 leads (I, II, V1–V6) recorded at 500 Hz. The EHR model is an Extreme Gradient Boosting (XGBoost) model that uses tabular clinical data (demographics, comorbidities, labs, and vital signs) and electrocardiogram morphology parameters to predict the likelihood of pulmonary embolism. Finally, the fusion model is an XGBoost model that uses a principal component decomposition of an electrocardiogram waveform embedding from the electrocardiogram model, tabular clinical data, and electrocardiogram morphology parameters in an XGBoost framework to predict the likelihood of pulmonary embolism. (B) Mean receiver-operating characteristic (top) and precision-recall (bottom) curves with 95% confidence intervals for the electrocardiogram (red), EHR (blue), and Fusion (orange) models, with the mean and standard deviations for the area under each respective curve (AUROC, AUPRC) in the figure legend. In top plot, the horizontal and vertical lines correspond to optimal threshold. The Fusion model outperforms both the electrocardiogram and EHR models. (C) SHAP dependency plots for the EHR model (top) and Fusion model (bottom), representing the marginal contribution from patient encounters in the test set (dots, coloured by value of feature) of different features (y-axis, in descending order of importance) on the model output (x-axis, positive favours increased pulmonary embolism likelihood). Grey dots represent samples with missing data points.

