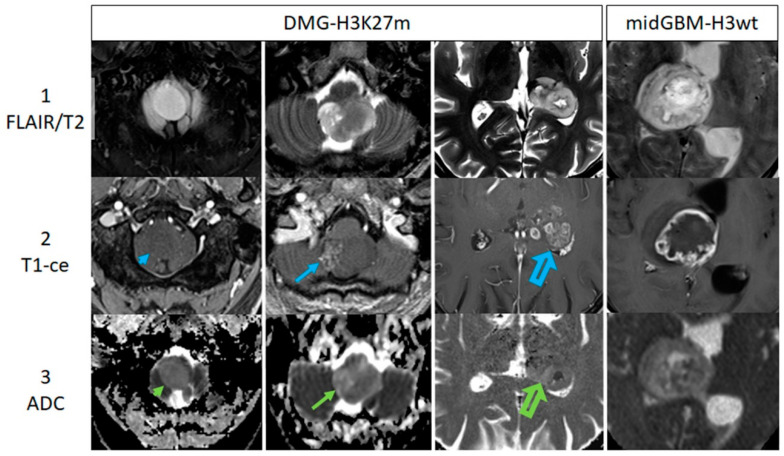
Figure 2.
This figure displays examples of MR imaging findings including DWI/ADC. The cases of four patients with midline gliomas are shown in columns from left to right (row 1 presenting FLAIR/T2w-images, row 2 representing ce-T1w images, and row 3 showing ADC maps). The first three columns present DMGs with increasing contrast enhancement from left to right: no enhancement (blue arrowhead), low enhancement (blue arrow) and strong enhancement (blue open arrow). The fourth column shows a case of a midline glioblastoma (midGBM-H3wt). Corresponding ADC-maps are shown in row 3, indicating the variance of inhomogeneity (green arrowhead/arrows pointing at the tumor).

