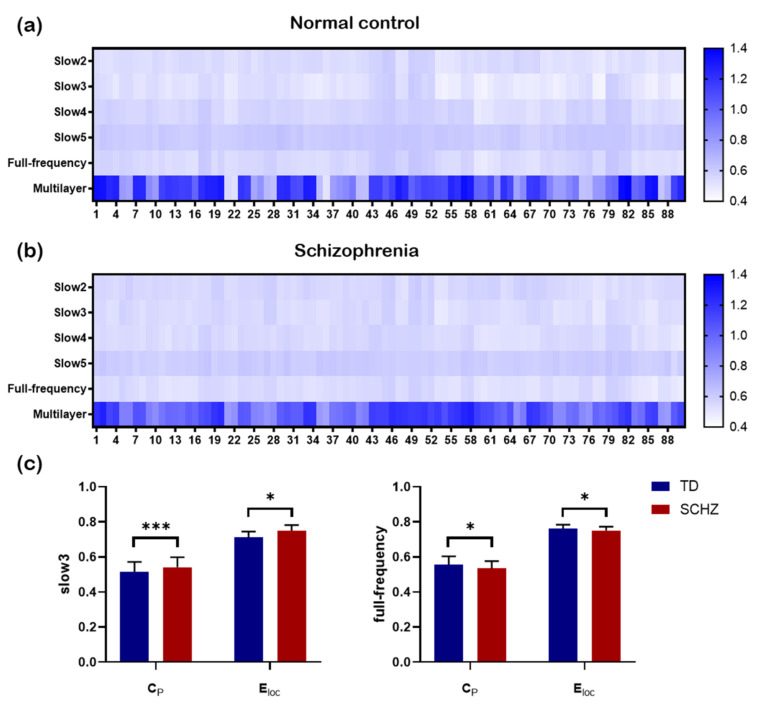
Figure 5.
The clustering coefficient values of 90 brain regions. (a) The clustering coefficient for each region for four single-layer frequency-specific networks and a multilayer network in the healthy group is shown. (b) The clustering coefficient for each region for four single-layer frequency-specific networks and a multilayer network in patients with schizophrenia is depicted. (c) The differences in the clustering coefficient (Cp) and local network efficiency (Eloc) between the two groups in the slow3 frequency and full-frequency are shown. * indicates 0.01 < p < 0.05. *** indicates p = 0.000.

