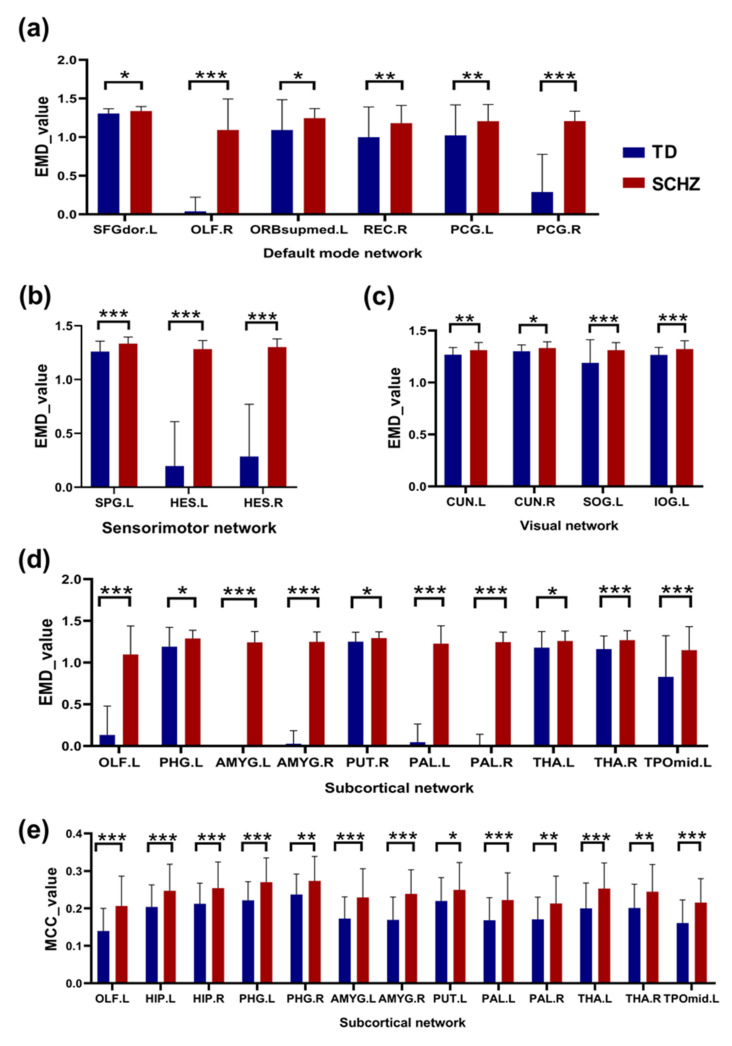
Figure 8.
Differences between normal controls and patients with schizophrenia (SCHZ) in terms of node vulnerability. Panels (a–d) represent the damaged brain areas detected in the default mode network, sensorimotor network, visual network and subcortical network, respectively, of the schizophrenia patients according to the entropy of the multiplex degree (EMD). Panel (e) represents the damaged brain areas in the subcortical network of schizophrenia under the multilayer clustering coefficient index (MCC). Asterisks indicate the difference between the groups and were divided into three cases: * 0.01 < p < 0.05, ** 0.001 < p < 0.01, and *** p = 0.000.

