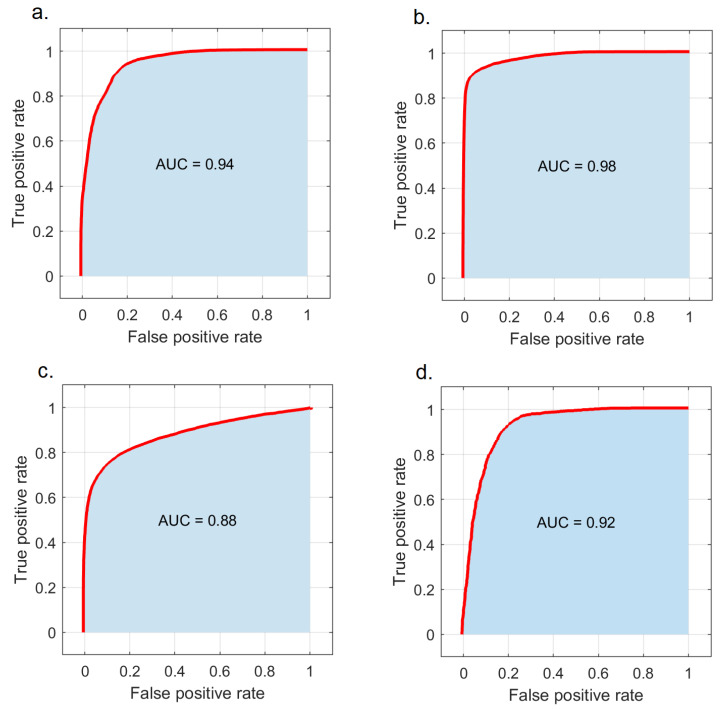
Figure 3.
Patient classification performance of the SVM classifier. (a) ROC curve obtained from PTG and OSSN classification. (b) ROC curve obtained from normalized normal and OSSN classification. (c) ROC curve obtained from normal and PTG classification. (d) ROC curve obtained from normal, PTG, and OSSN classification.

