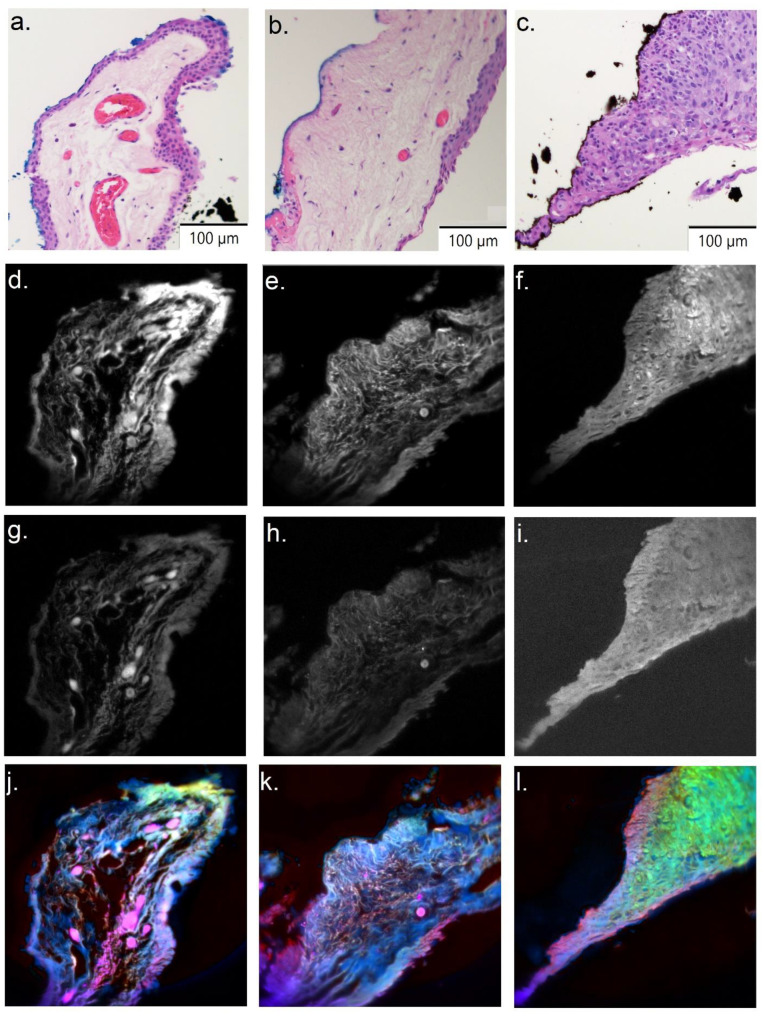
Figure 4.
Spectral differences between normal, PTG, and OSSN. (a–c) H&E image for normal, PTG, and OSSN sections, respectively. (d–f/g–i) Channel 1/Channel 20 for normal, PTG, and OSSN sections, respectively. (j–l) PCA false color image for normal, PTG, and OSSN sections respectively. OSSN is green, while normal and PTG are violet.

