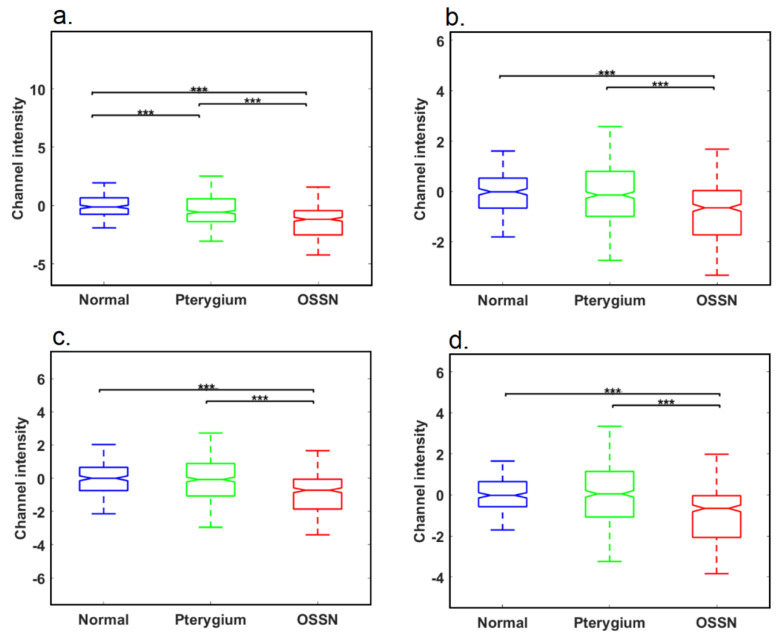
Figure 5.
Analysis of fluorophore signals in the tissue. (a) Intensity analysis for Channel 3 containing a contribution from elastin. (b) Intensity analysis for Channel 12 containing a contribution from lipopigment. (c) Intensity analysis for Channel 30 containing a contribution from flavins. (d) Intensity analysis for Channel 52 tentatively attributed to PPIX (*** represents p−value < 0.01). Corresponding sample channels are shown in Supplementary Figure S5.

