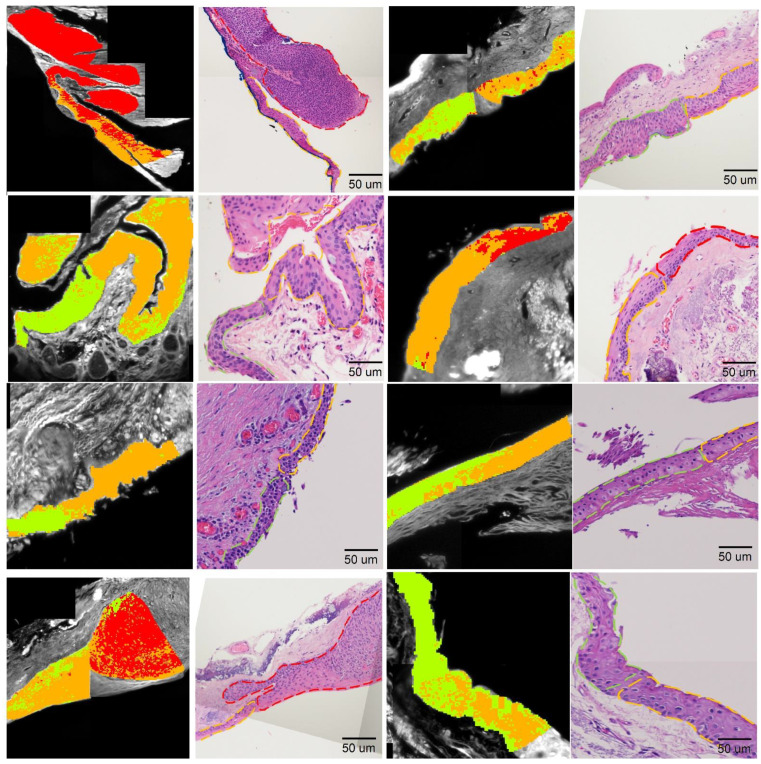
Figure 6.
False color map generated to locate the normal, PTG, and OSSN boundary on the testing section based on intra-patient classification framework compared to the associated histology images. The block data position on a single spectral channel (Chno = 10) image is colored in red/orange/green if they are predicted to be OSSN/PTG/normal. First/third column is the multispectral false-color map. Second/forth column is corresponding H&E section with red, orange, and green dash lines highlighting OSSN, PTG, and normal section.

