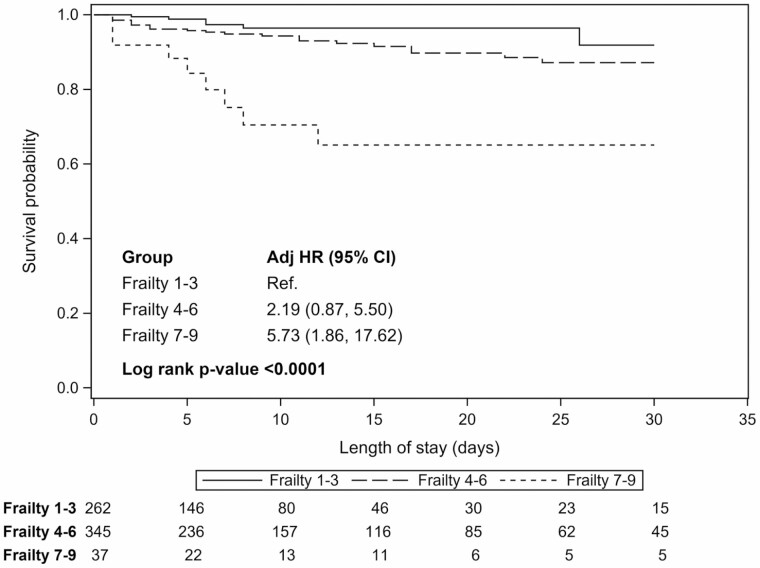
Figure 2.
Time to mortality. 1) Survival probabilities, stratified by Rockwood Frailty Score at admission, were estimated using the Kaplan–Meier estimator. Individuals were followed from admission until death, hospital discharge, or the end of study follow-up (30 days), whichever occurred earliest. Individuals who were discharged alive or who remained alive until the end of study follow-up were censored. 2) Hazard ratios (HRs) were estimated using a Cox proportional hazards regression model. Individuals were followed from admission until death, hospital discharge, or the end of study follow-up (30 days), whichever occurred earliest. Individuals who were discharged alive or who remained alive until the end of study follow-up were censored. The model adjusted for age at admission, TBSA (modeled using linear splines), and inhalation injuries (yes/no).

