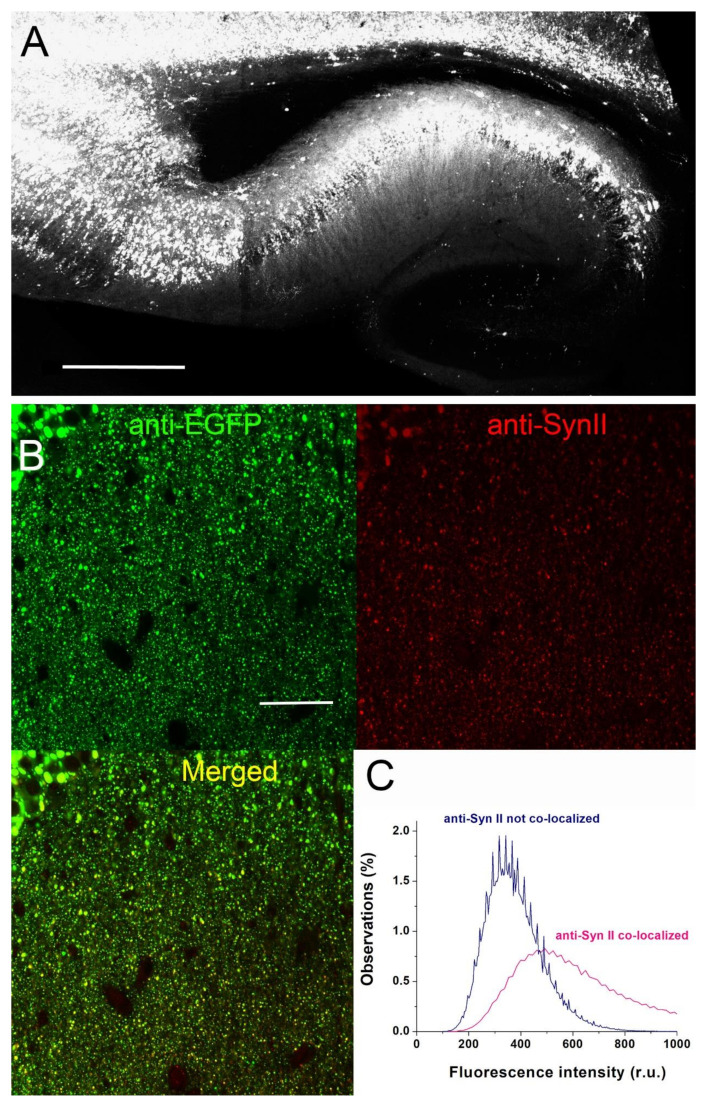
Figure 2.
Expression of SynII-TurboGFP in the hippocampus of AAV-injected mice. (A) SynII-TurboGFP expression in the hippocampus and cortex after neonatal ICV injection of AAV1.hSyn.Syn2-Turbo-GFP. Scale 500 µm. (B) High-magnification image of a small section of the Str. Radiatum showing the punctate immunoreactivity expected for SynII-TurboGFP. Scale 50 µm. (C) The distributions of the anti-Syn II fluorescence for the pixels colocalized (pink) and not colocalized (navy) with the anti-GFP signal (green channel). Colocalization was assessed using ImageJ plugin Coloc 2. Note that the non-colocalized signal matches the background peak observed for Syn2 KO slices (shown in Figure 1C), while the colocalized peak matches the anti-Syn II signal observed in WT slices (p < 0.001 per K-S test).

