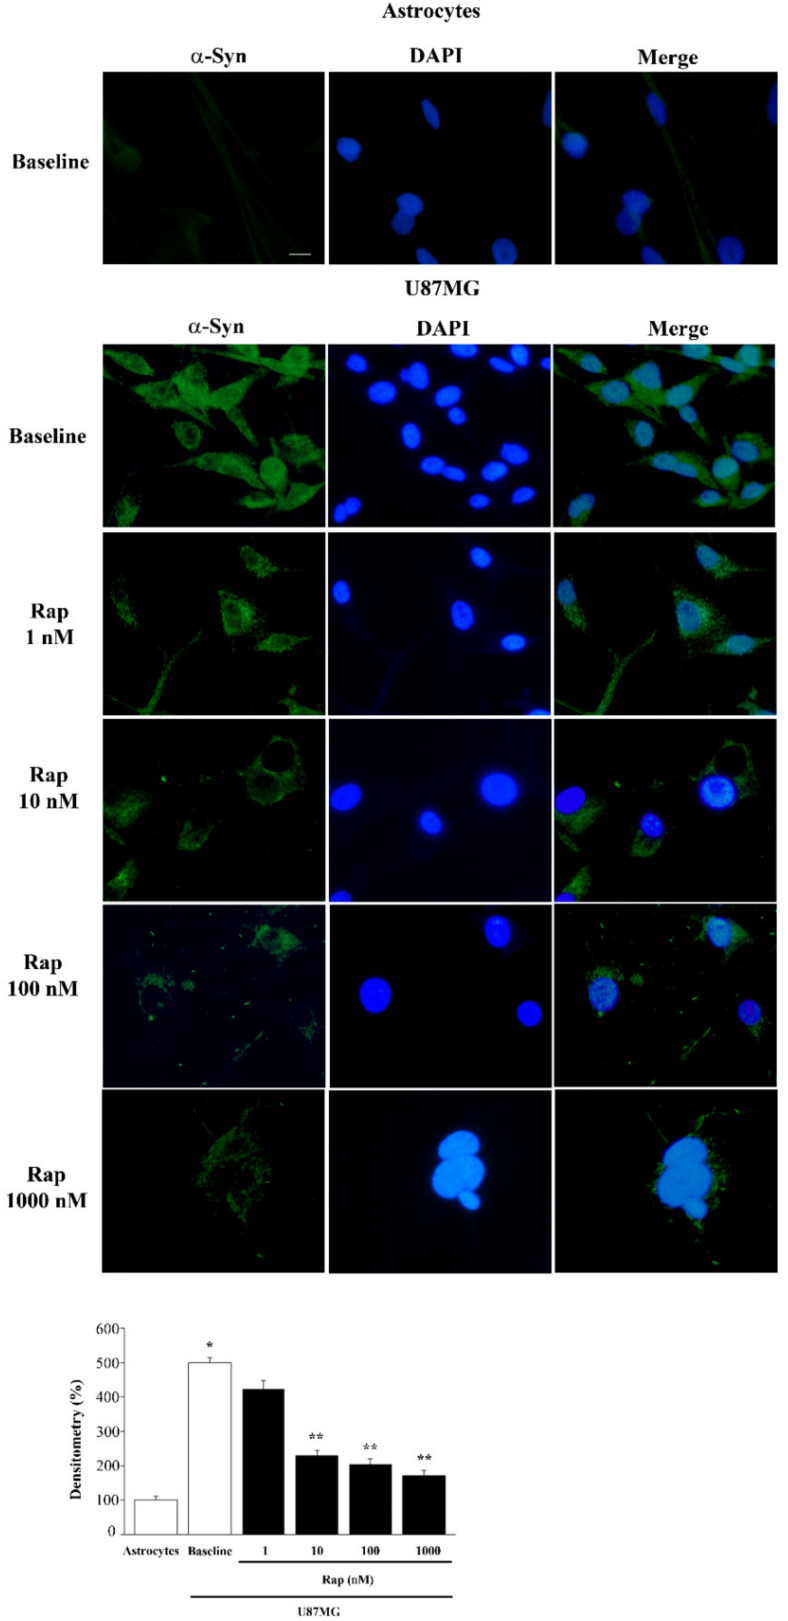
Figure 5.
Rapamycin dose-dependently reduced α-syn immuno-fluorescence. Representative pictures of α-syn-positive astrocytes and U87MG cells, in baseline conditions and following rapamycin (Rap) exposure. Each cell nucleus is visualized using DAPI (blue). In these cells, the amount of α-syn is stained by a green fluorescent-labeled secondary antibody (Alexa 488, green). The graph reports the densitometry of α-syn immuno-fluorescence within astrocytes compared with U87MG cells, in baseline conditions and following rapamycin exposure. Data are given as the mean percentage ± SEM of optical density for each experimental group (assuming controls as 100%) obtained from n = 30 cells per group in a total of N = 3 independent experiments. * p < 0.05 compared with astrocytes; ** p < 0.05 compared with baseline and Rap 1 nM in U87MG. Scale bar = 12 μm.

