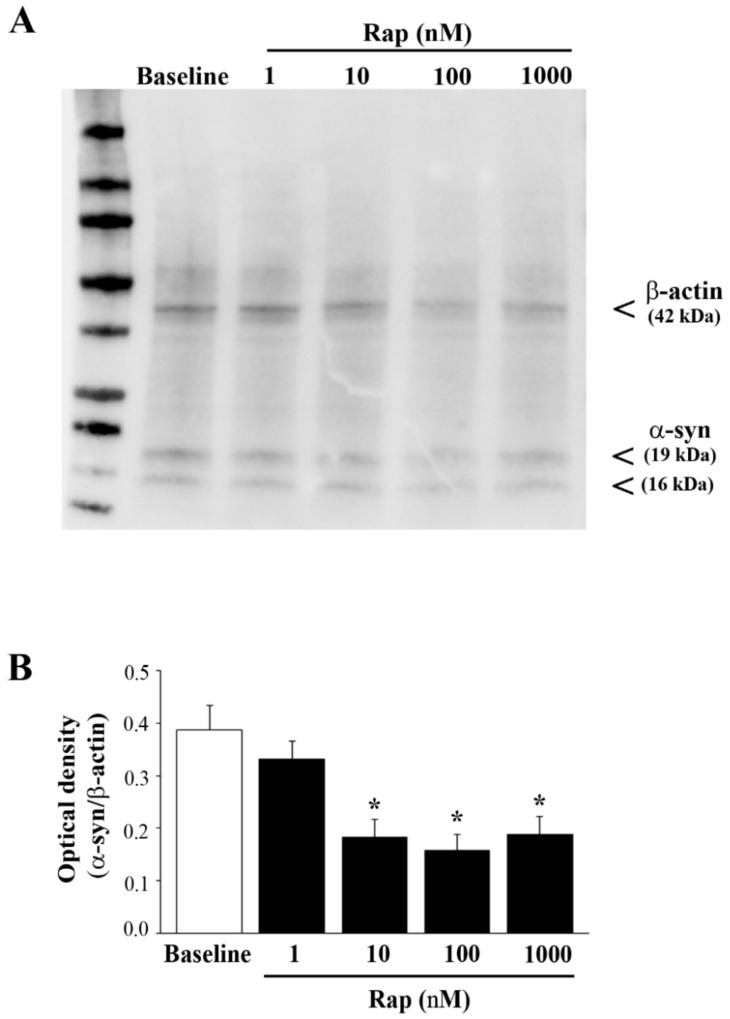
Figure 8.
Rapamycin reduced α-syn assessed by immunoblotting. (A) Representative immunoblotting for α-syn and the housekeeping β-actin in baseline conditions (baseline) and in rapamycin-treated U87MG cells. (B) The ratio between the optical densities of α-syn and β-actin is reported in the graph. Data are given as the mean ± SEM of the optical density of n = 5 values for each experimental group, measured in N = 5 independent experiments. The original figure of Figure 8A can be found in Supplementary Figure S4. * p < 0.05 compared with baseline.

