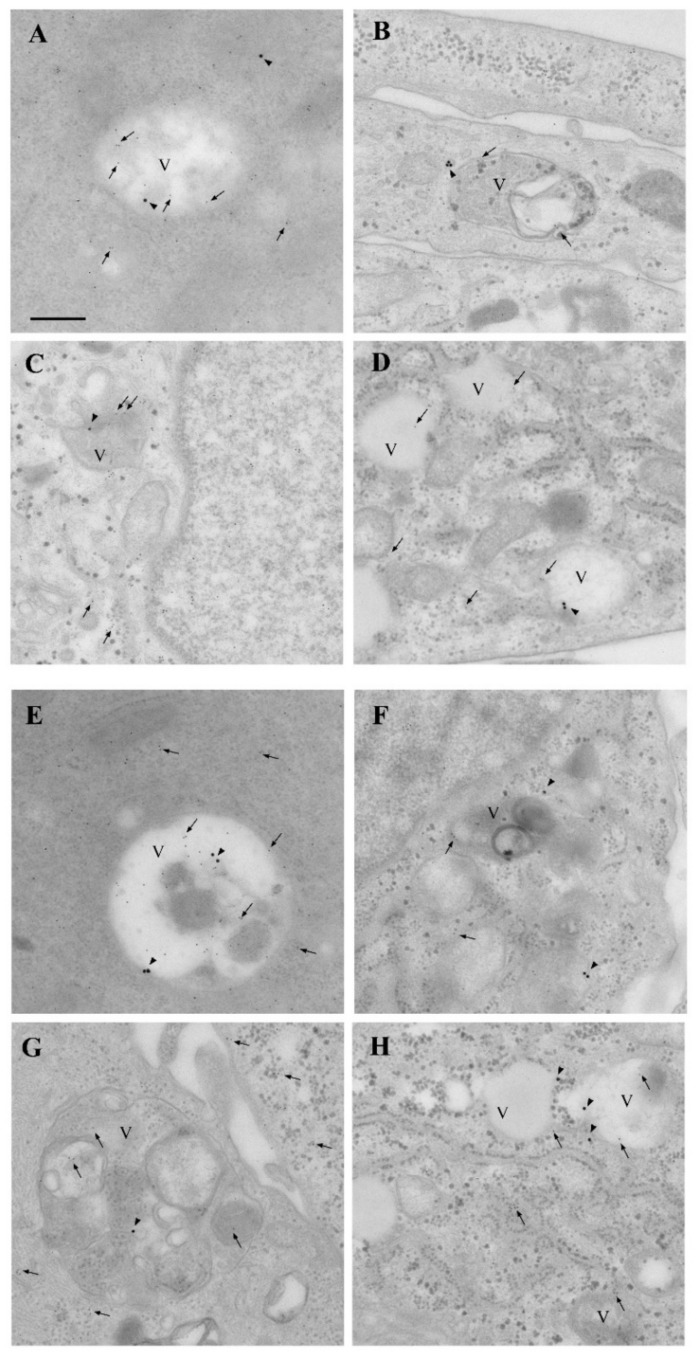
Figure 14.
Rapamycin-induced α-syn + LC3- and α-syn + cathepsin D-positive vacuoles in GBM cells. Representative micrographs showing astrocytes (A,E) and U87MG cells (B,F), in baseline conditions and following rapamycin exposure at 10 nM (C,G) and 100 nM (D,H). Immuno-gold for α-syn (20 nm) and LC3 (10 nm) is shown in (A–D), while immuno-gold for α-syn (20 nm) and cathepsin D (10 nm) is shown in (E–H). Arrowheads = α-syn immuno-gold particles; arrows = LC3 or cathepsin D immuno-gold particles. V = vacuole. Scale bar = 0.15 μm.

