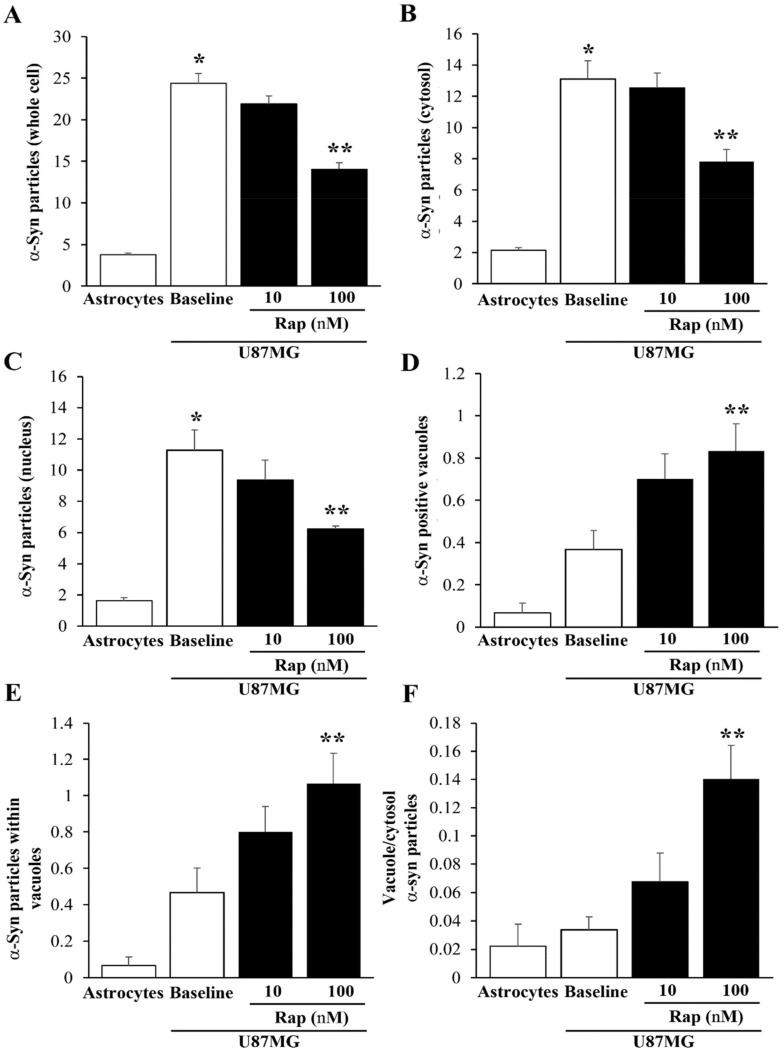
Figure 17.
Count of PK-resistant α-syn immuno-gold within astrocytes and U87MG cells. Graphs report the number of α-syn immuno-gold particles within the whole cell (A), cytosol (B), and nucleus (C). The number of α-syn-positive vacuoles is reported in (D), while the mean number of α-syn immuno-gold particles within each vacuole is reported in (E). The ratio of α-syn immuno-gold particles within vacuoles vs. the cytosol is reported in (F). These data were obtained from astrocytes and U87MG after PK treatment in baseline conditions and following rapamycin exposure (Rap 10 nM and Rap 100 nM). Data are given as the mean ± SEM from n = 30 cells per experimental group, obtained from N = 3 independent experiments. * p < 0.05 compared with astrocytes; ** p < 0.05 compared with baseline.

